CFG
View the control-flow graph (CFG) produced by analysis.
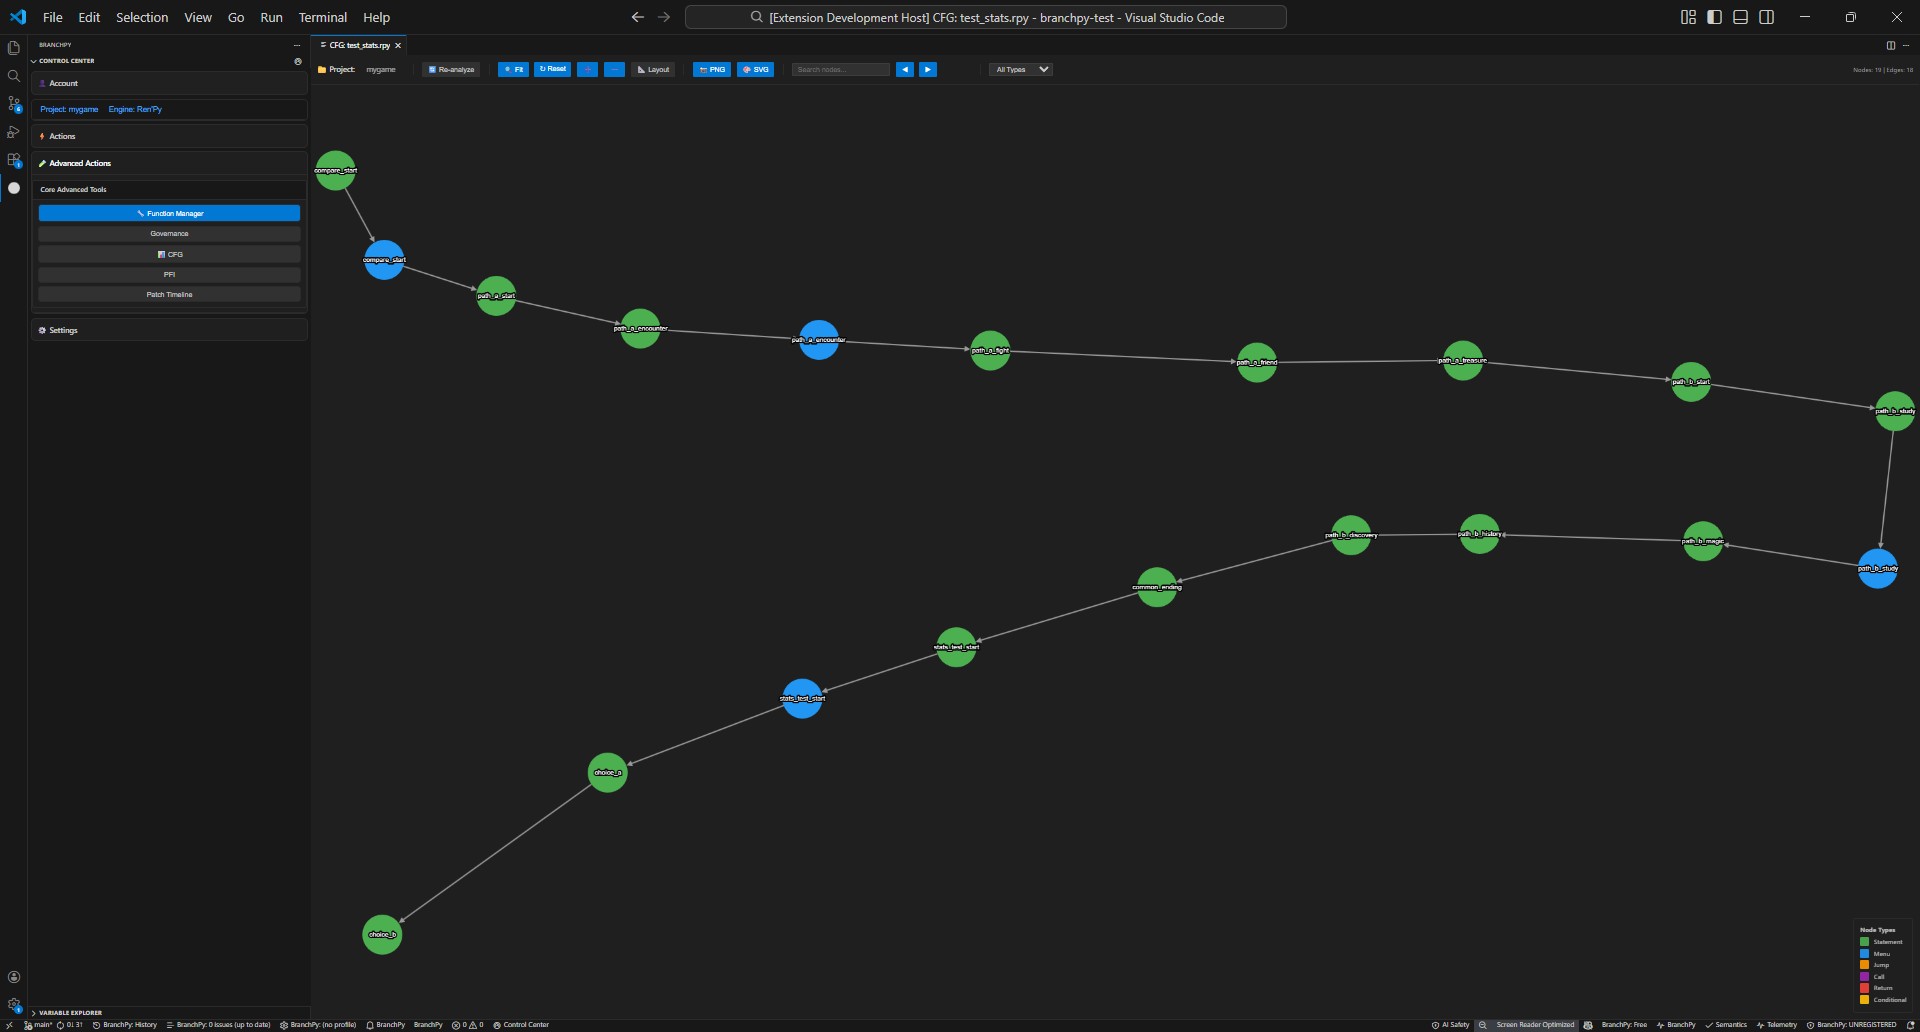
What it shows: story nodes, branches, and jump/call edges with metrics overlays.
When to use: after an Analyze run to validate flow structure, spot dead ends, and review new edges from PFI/SAE.
How to navigate: open the Flowchart/CFG panel from Analyze or Stats, select a node to see details, and use zoom/filter controls to focus on areas of interest.
Learn more: Technical/analysis