Excusez-nous — cette page est actuellement disponible en anglais uniquement.
La traduction française n'est pas encore prête. Le contenu ci-dessous est la version anglaise la plus récente.
This page has moved. Flowchart (Standard) and Flowchart+ are now documented together on a single unified page.
Flowchart+ is not a separate feature — it is the same Flowchart panel running in Plus mode, activated automatically when your Analyze run includes D9 Narrative Analysis data.
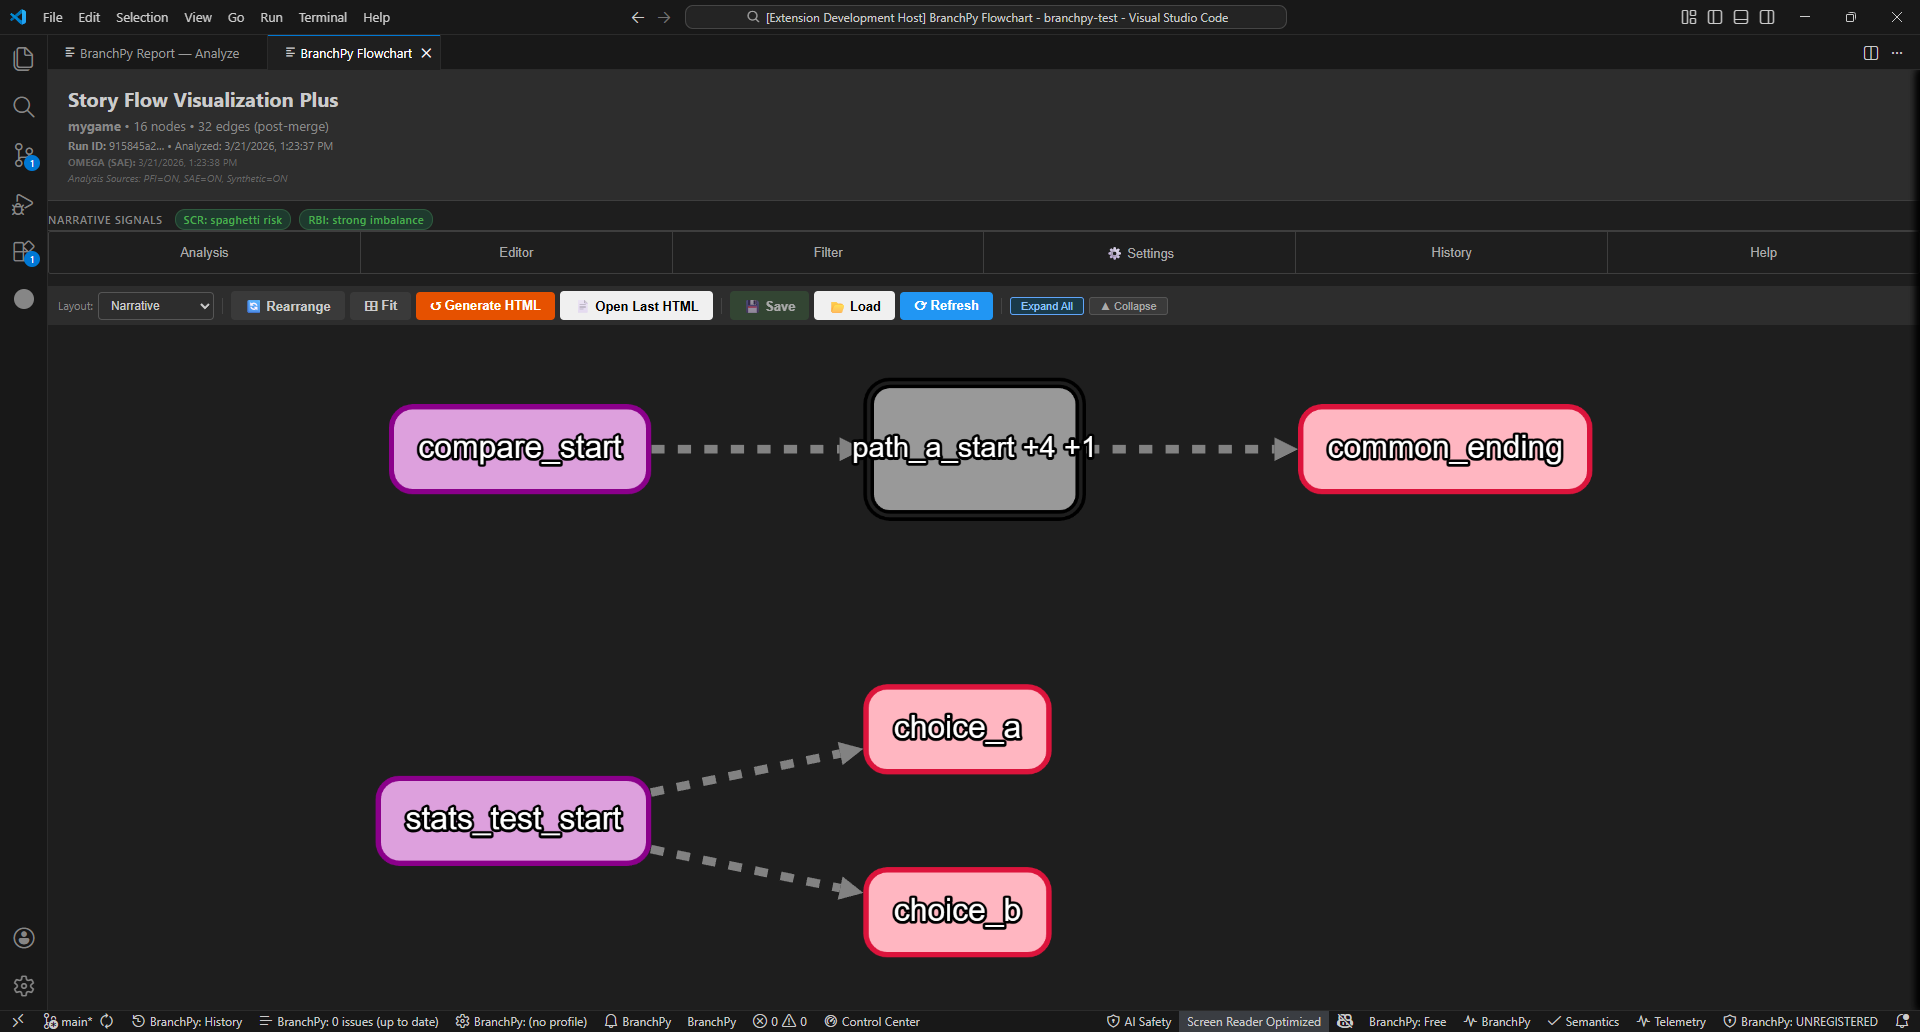
Current scope (Phase 3): Flowchart+ today delivers a compatibility status view: gating state (READY / STALE / BLOCKED), SCR and RBI signal pills, and a layout selector. The full interactive graph — grouping, editing, export, node navigation — is in development (Phase 4) and is not yet available in Plus mode. Full documentation for the Standard interactive viewer is on the Flowchart page.
Full documentation for the Plus-specific features (SCR/RBI narrative signals, Narrative layout mode) is below. The Standard interactive viewer (all node types, graph navigation, grouping, export) is documented on the Flowchart page and will be available in Plus mode in Phase 4.
Requirements
Available on Ren’Py Free tier and above.
A Flowchart+ run (showing the “Story Flow Visualization Plus” title) requires an Analyze run with D9 Narrative Analysis enabled. If D9 is off or unavailable, the panel opens as the standard “Story Flow Visualization” without the narrative signal pills. There is no error — it just falls back to the base tier gracefully.
FlowchartPlus has no standalone CLI command. It activates automatically in the VS Code Control Center when all required data is present. To prepare from the CLI:
branchpy --project <path> analyze
branchpy --project <path> pilot
branchpy omega --project-root <path>
Then open FlowchartPlus from the BranchPy Control Center in VS Code.
Plus-only features (available today)
Narrative Signal pills
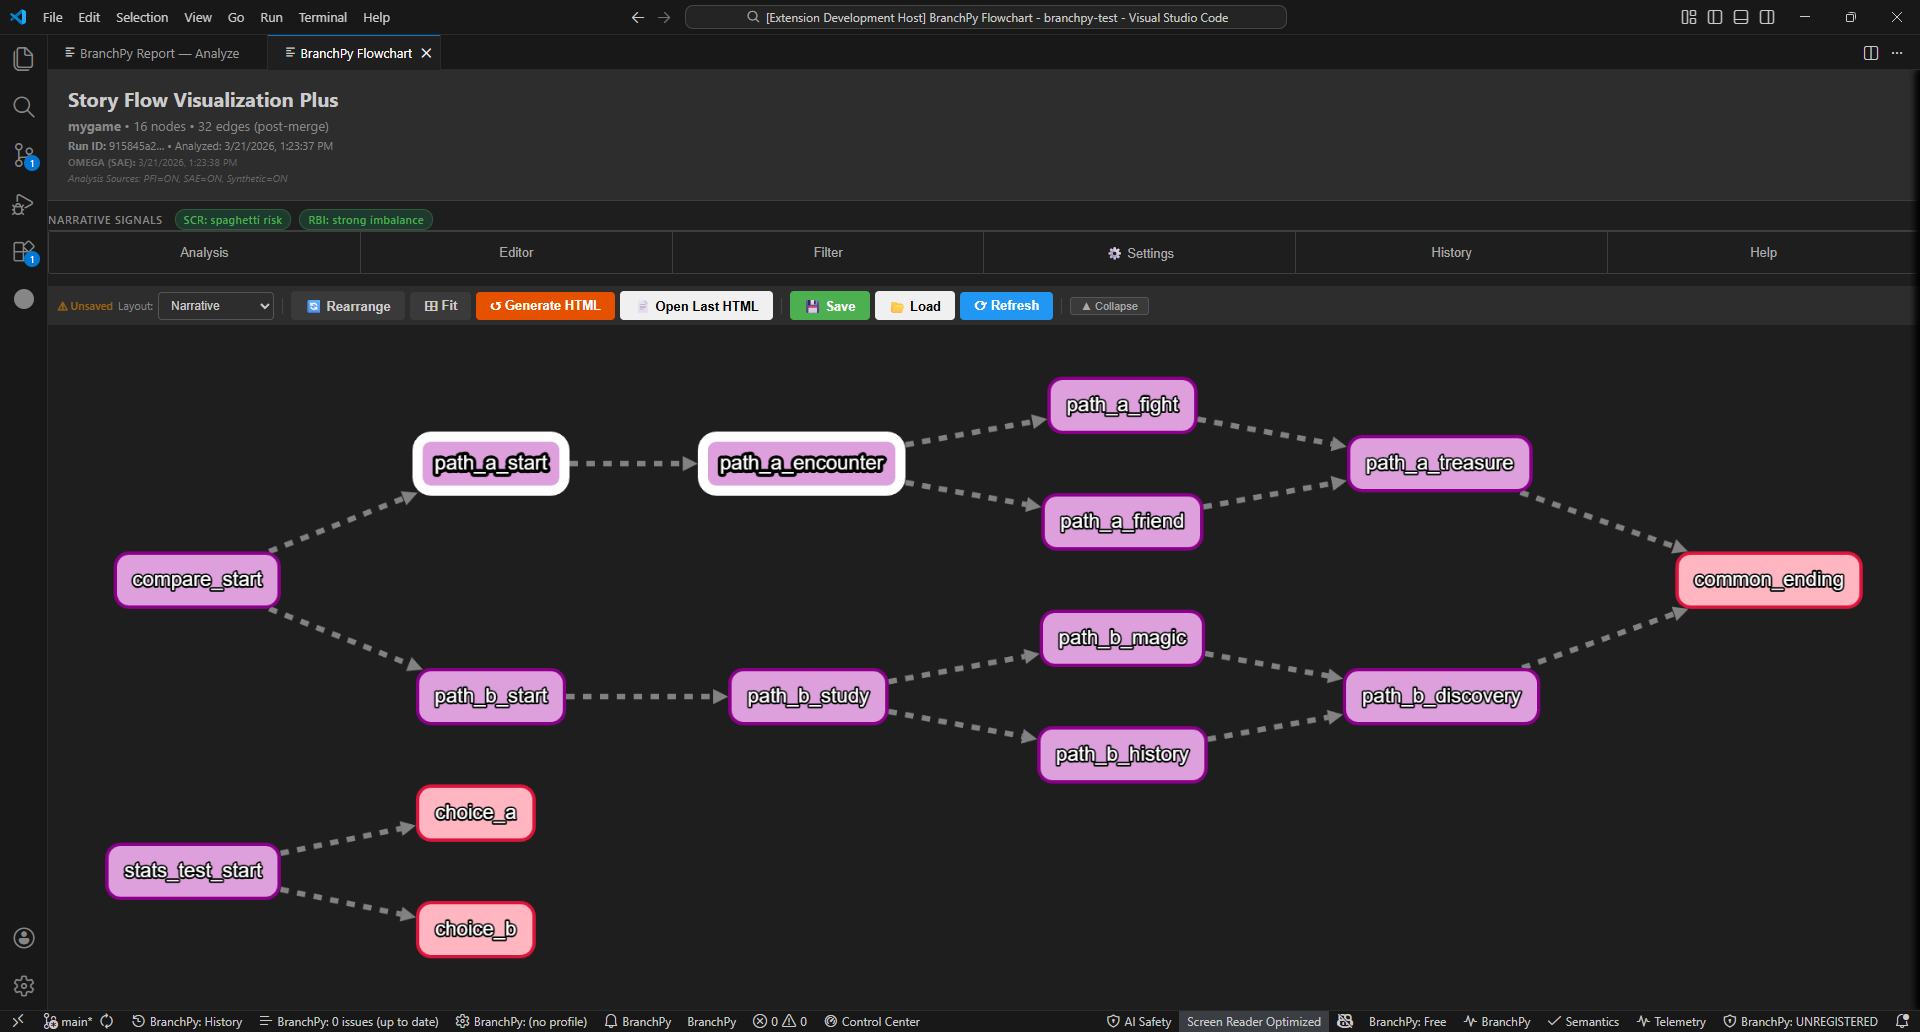
When Flowchart+ renders, two compact pills appear immediately below the project name.
| Pill | What it measures |
|---|---|
| SCR — Structural Complexity Rating | How structurally complex your story is. Bands: extremely clean · healthy · busy · difficult · spaghetti risk |
| RBI — Route Balance Index | How evenly your story’s routes are distributed across branches. Bands: balanced · mild imbalance · strong imbalance · extreme imbalance |
These come directly from the D9 Narrative Analysis results — the same values shown in analyze --summary and analyze --html reports. Seeing them inline in the graph view means you don’t need to switch to the text report to get a structural health check.
The sections below describe Standard Flowchart features that will also be available in Plus mode in Phase 4. They are not yet accessible from the Flowchart+ panel.
Full feature set (Standard; Phase 4 for Plus)
Flowchart+ will include the complete interactive viewer documented in Flowchart:
Graph navigation
- Pan and zoom — click-drag canvas, mouse wheel, or trackpad pinch
- Fit Graph — centers and scales to the full graph in one click
- Minimap — bottom-right overlay shows the full graph; drag the viewport rectangle to jump to any area
- Search — find any node by label name and center the viewport on it
Label details
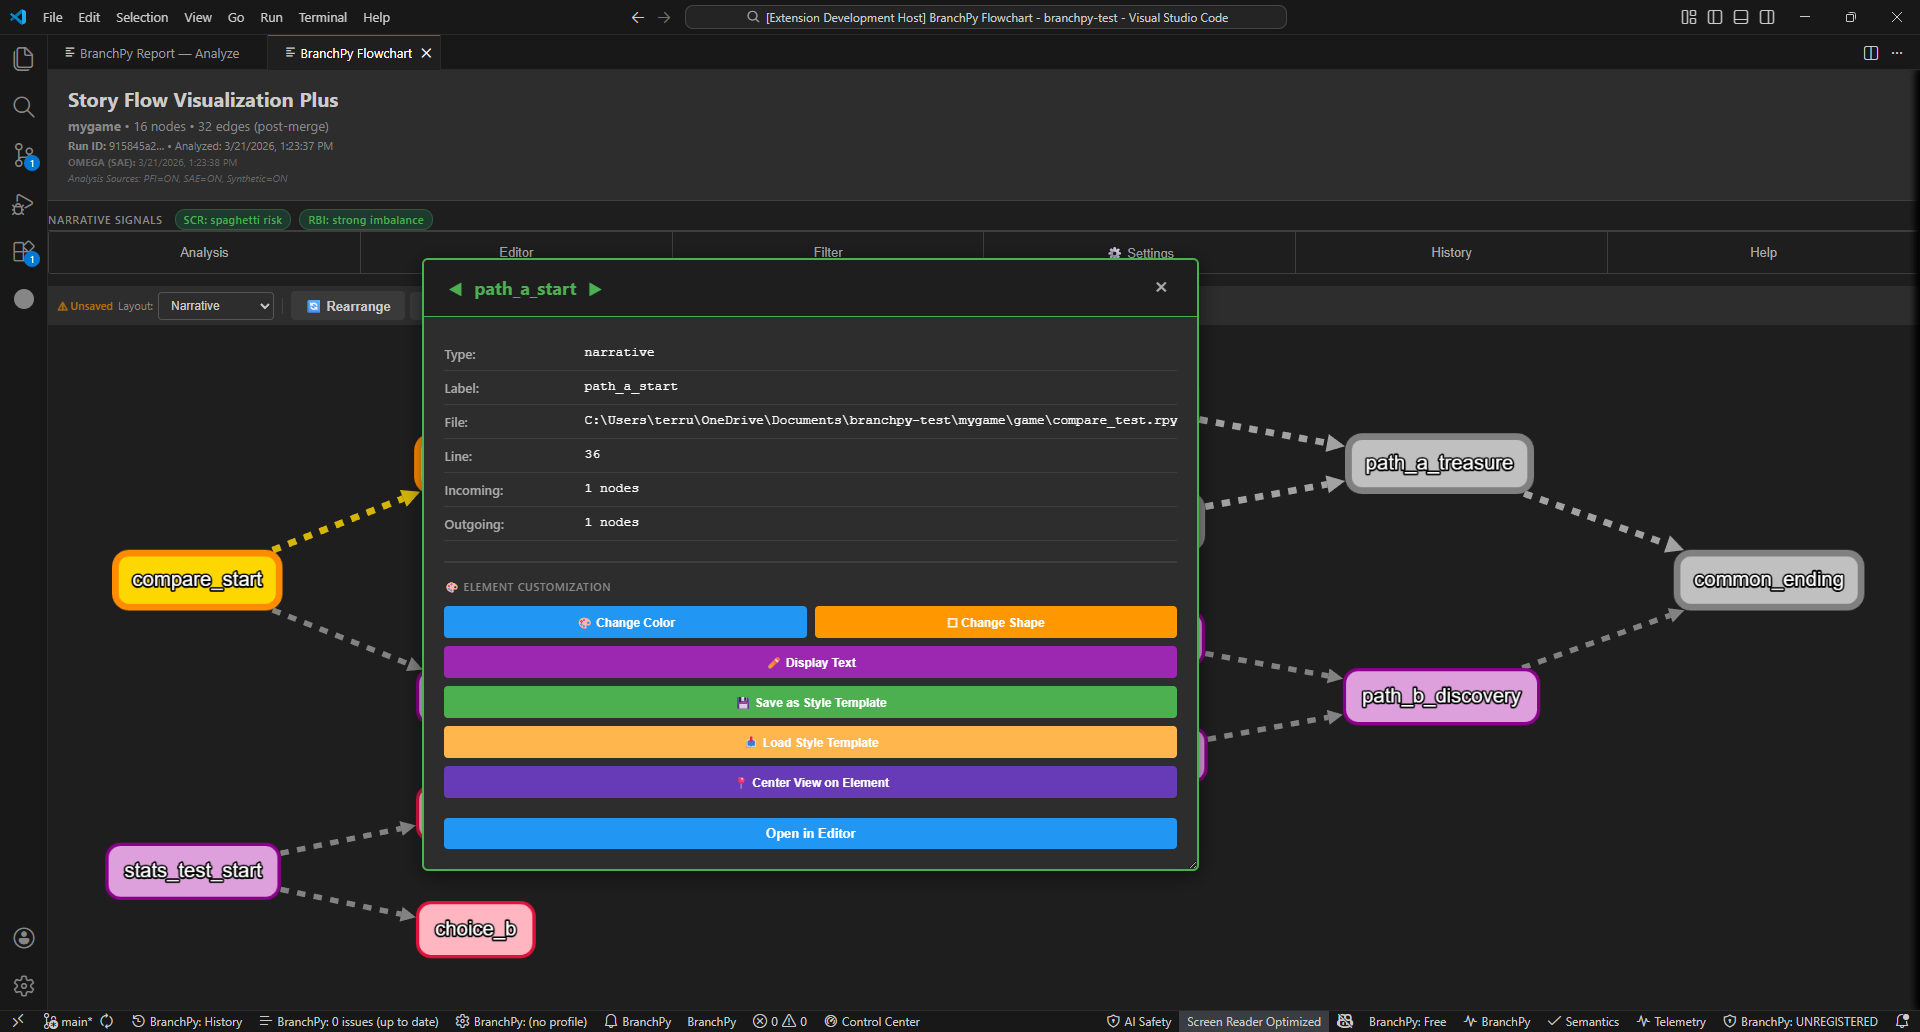
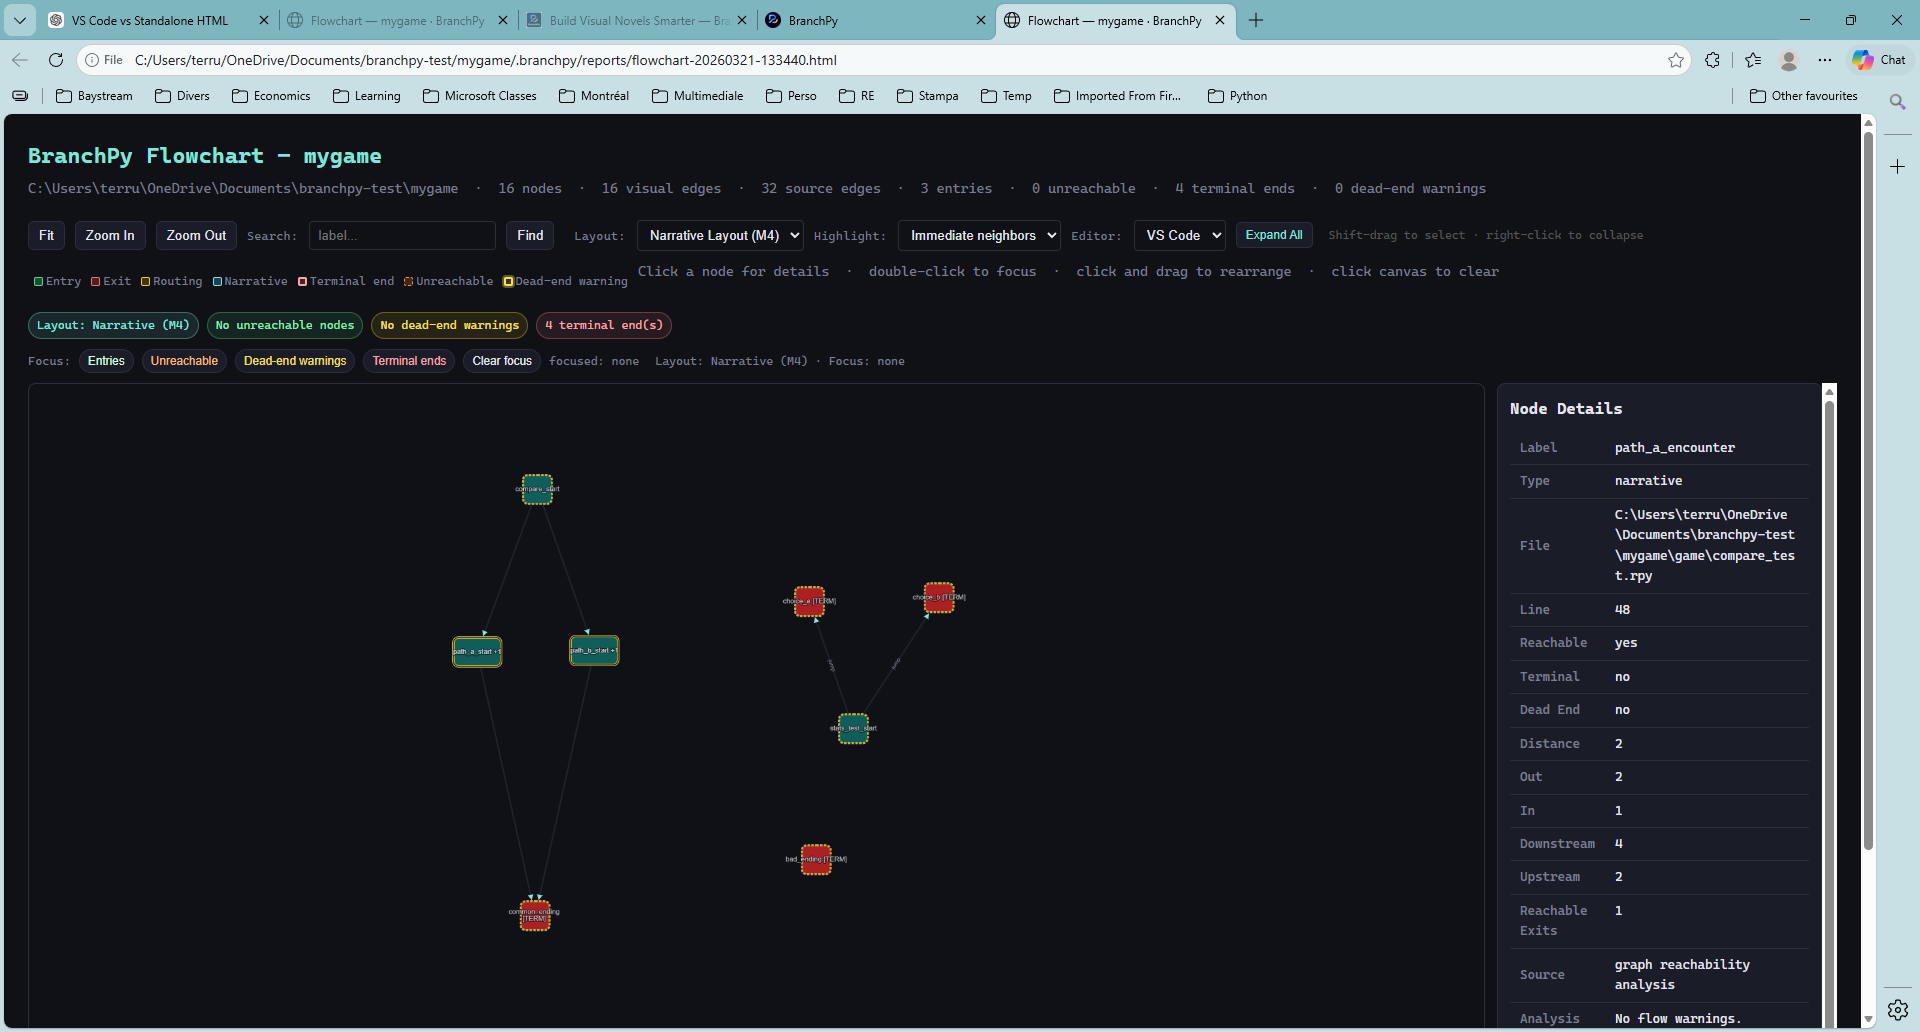
Click any node to open its detail popup. The popup shows type, file, line number, incoming/outgoing edge counts, and customisation controls. Open in Editor jumps to that label in your VS Code editor immediately.
Multi-select
Hold Shift and drag to box-select multiple nodes. Hold Ctrl and click to toggle individual nodes. The selection count appears in the Analysis tab.
With nodes selected: highlight all, hide all, fit view to selection, or collapse into a group.
Grouping and collapsing labels
Select 2+ nodes and collapse them into a compact group node — useful for hiding paths you are not currently working on.
Collapse: Right-click → Collapse Highlighted Nodes, or use the ▲ Collapse toolbar button.
Multiple groups: Collapse several independent paths at the same time.
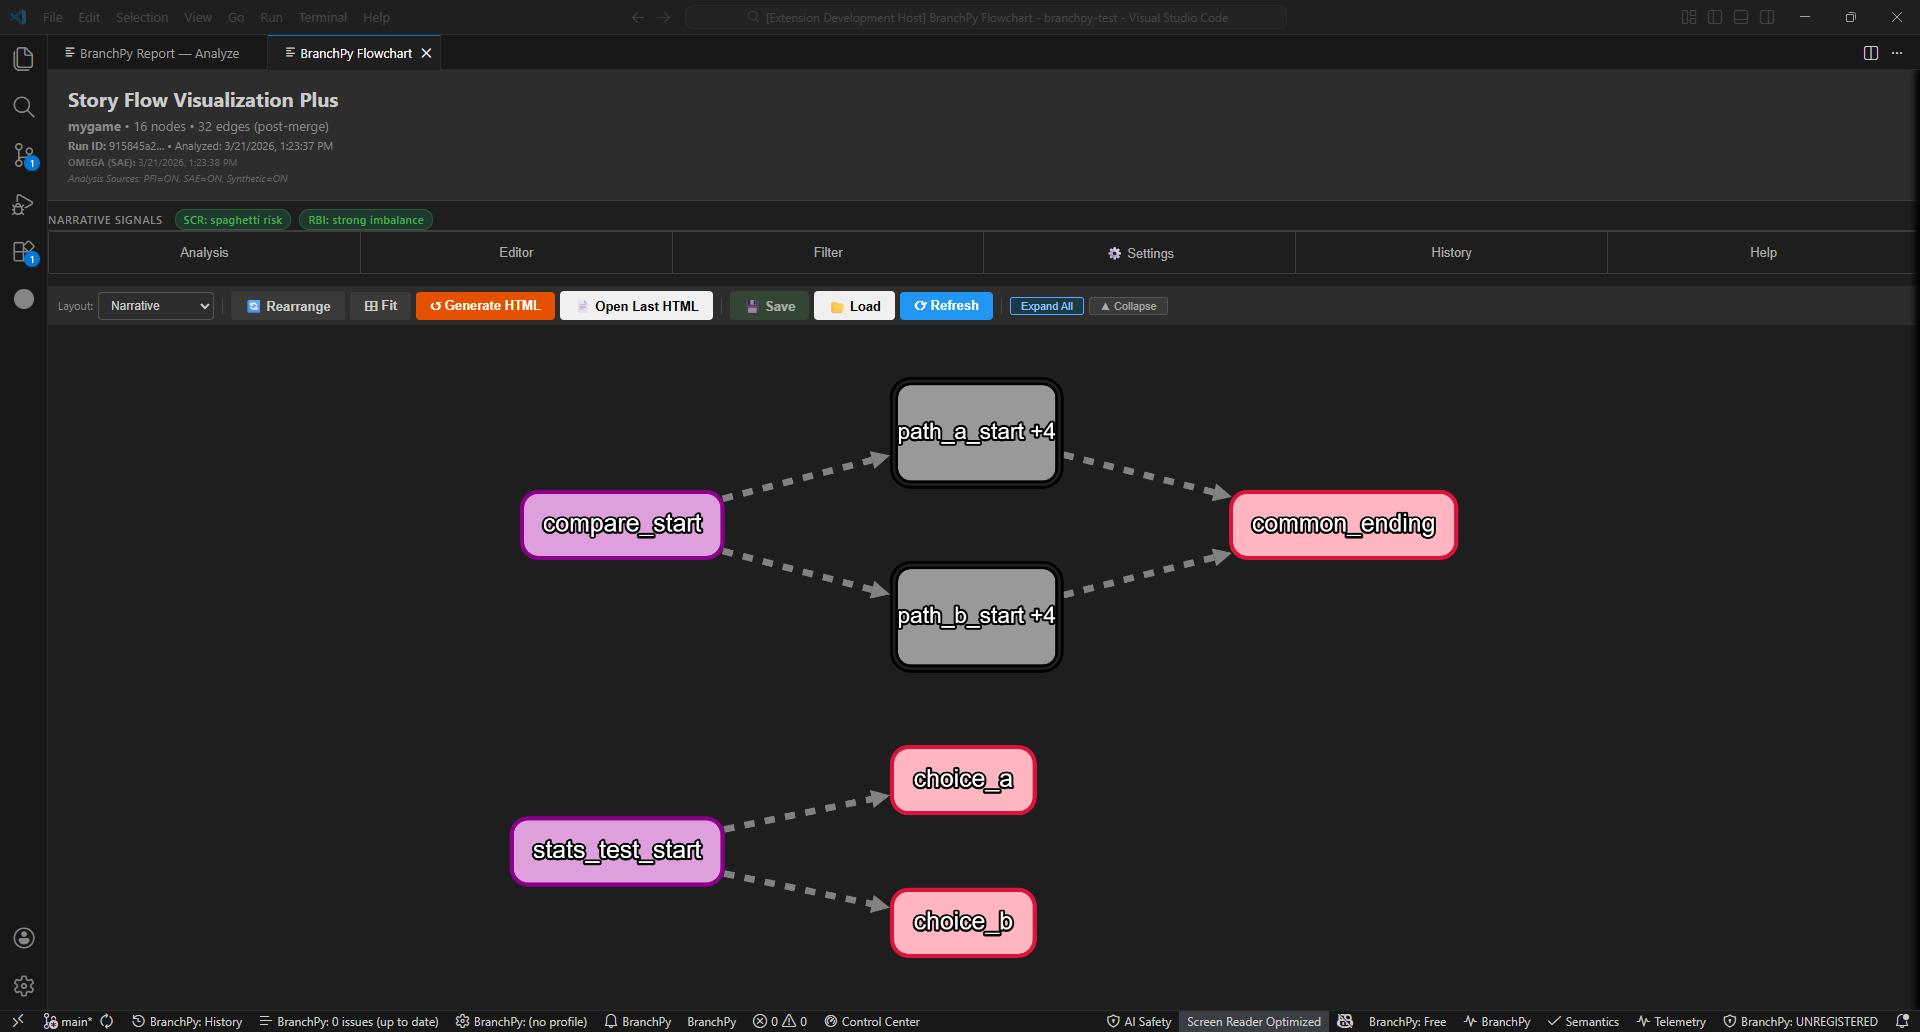
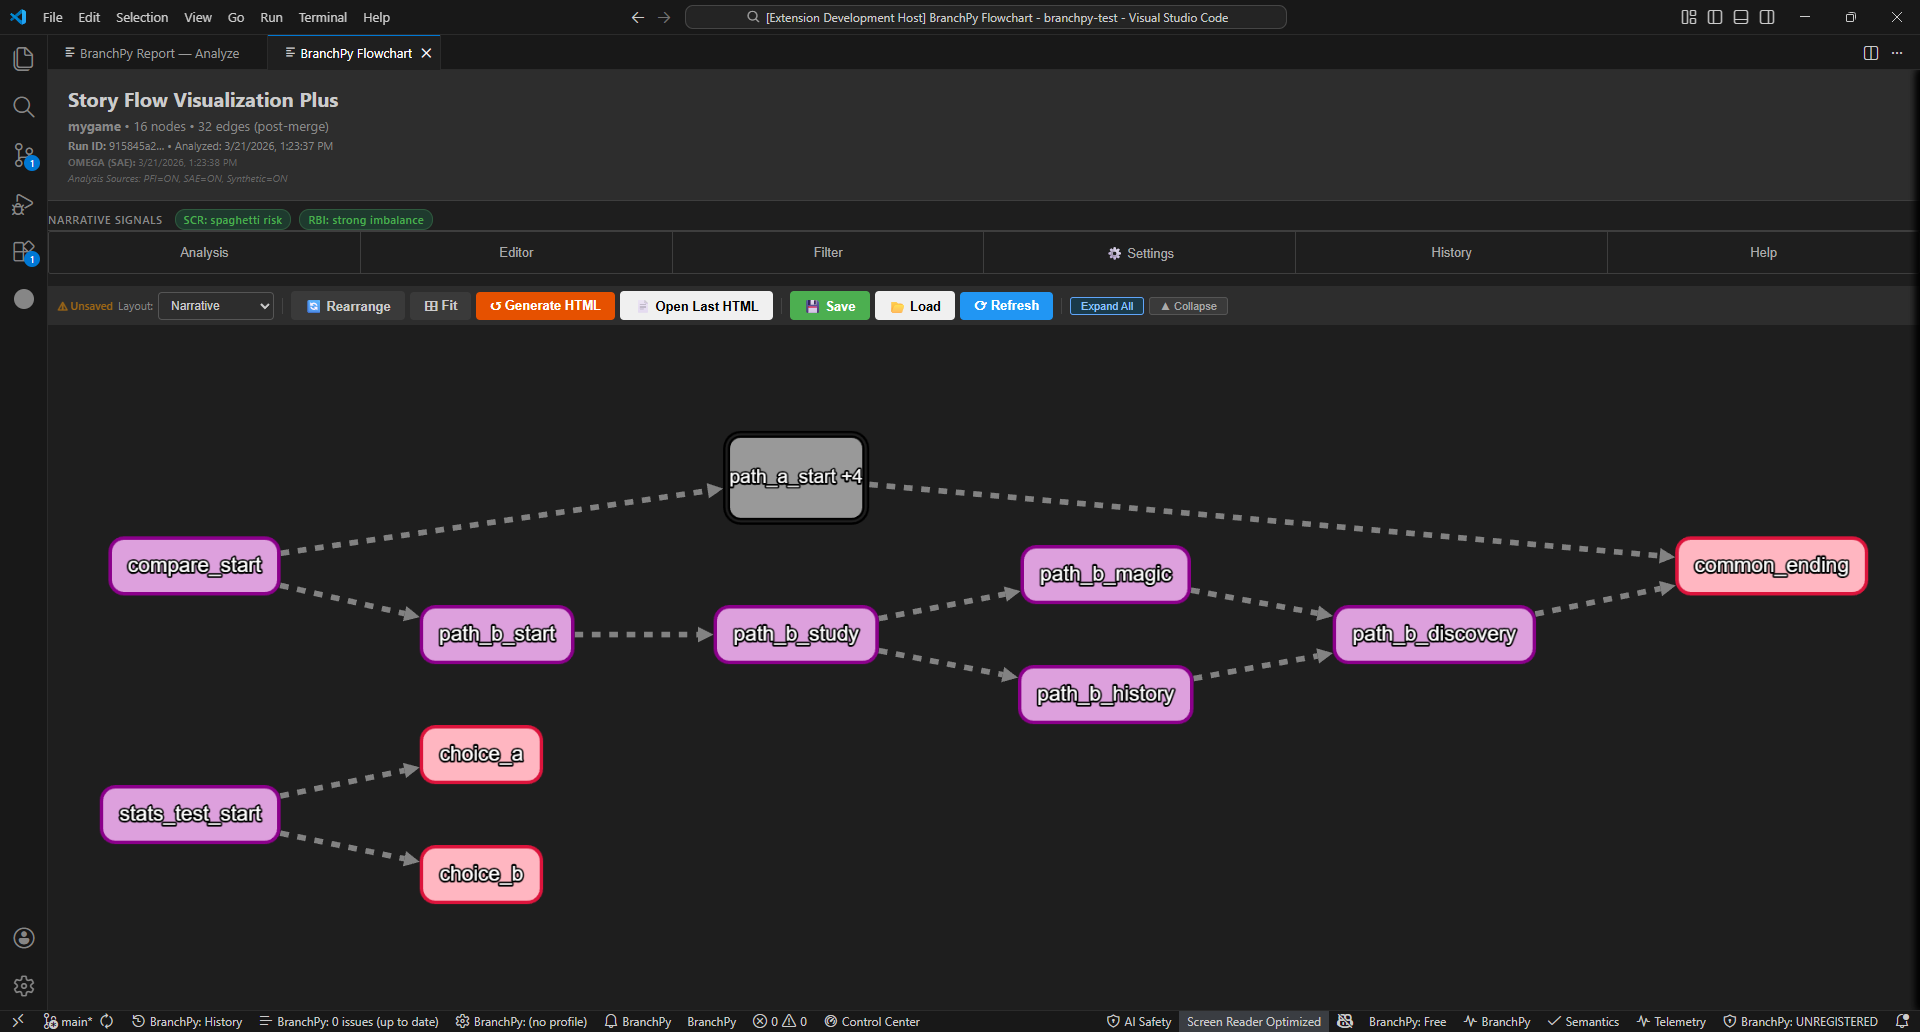
Nested groups: Collapse a group node together with additional nodes to fold further. The label stacks the counts (e.g. path_a_start +4 +1).
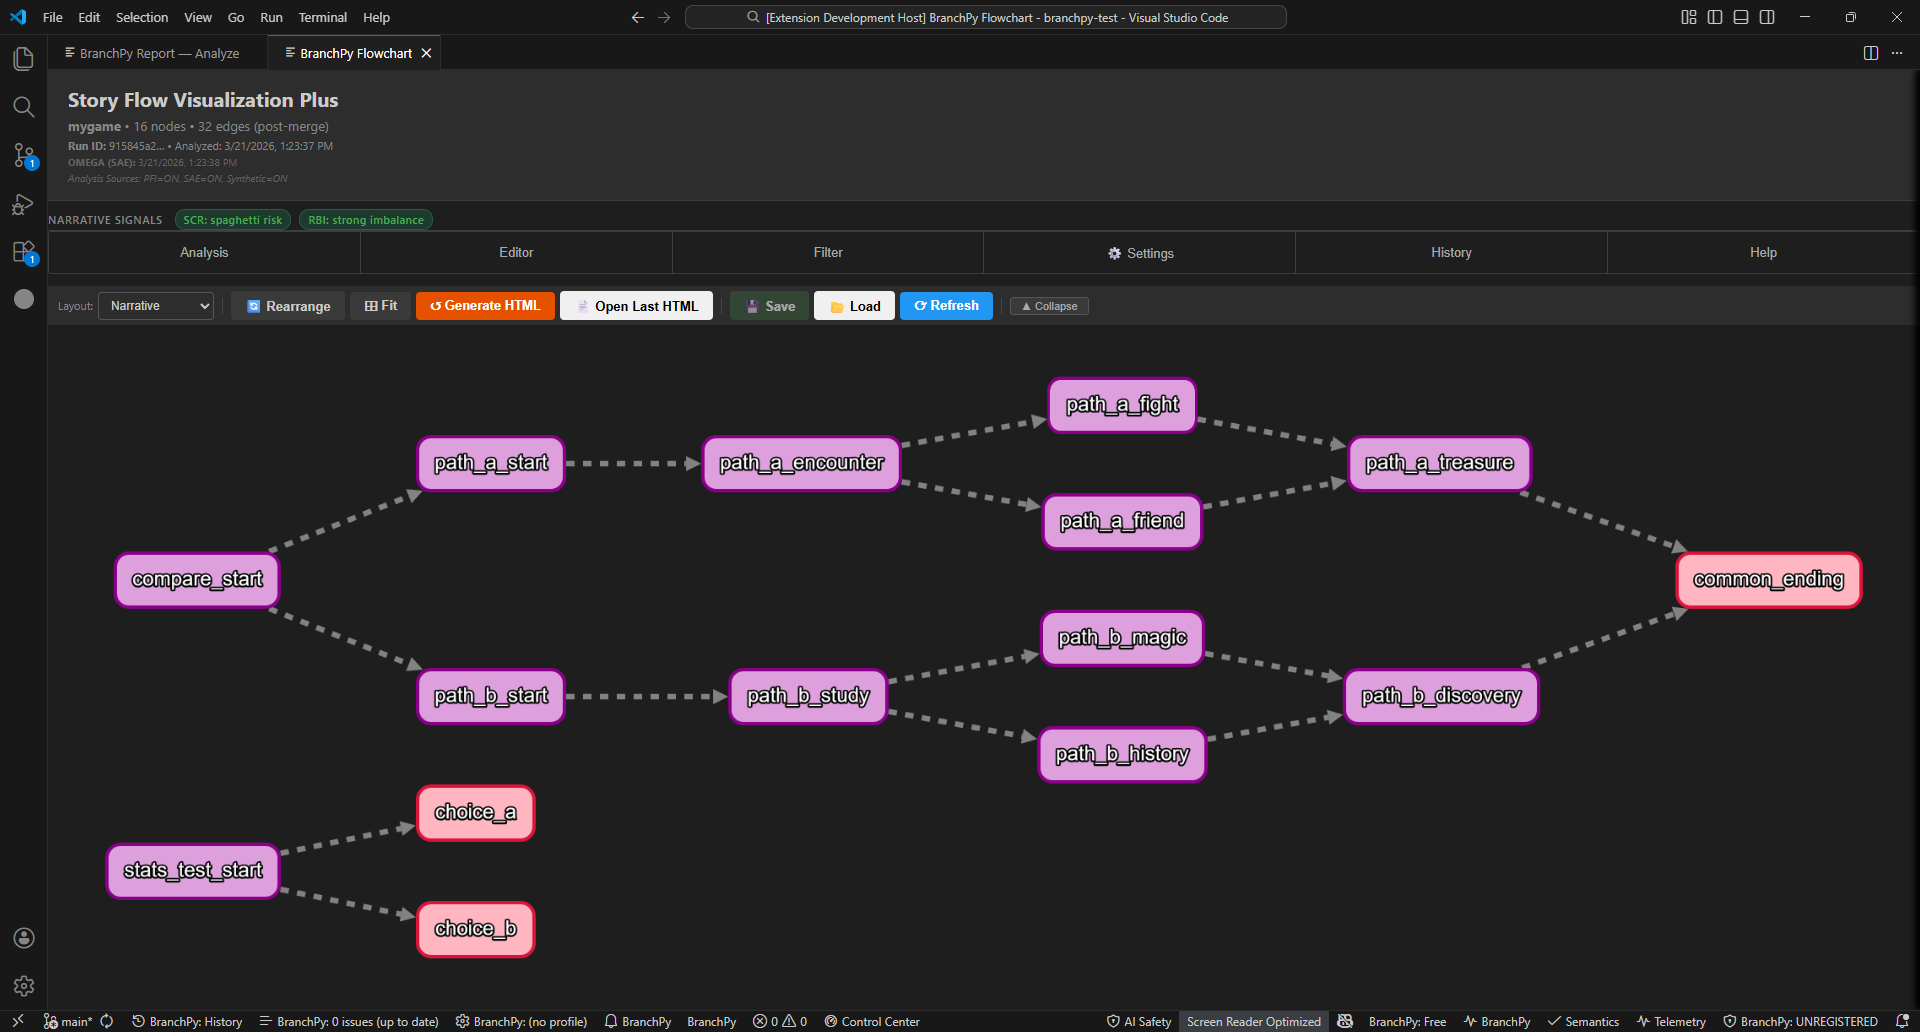
Expand: Right-click a group → Expand This Group. Or click Expand All in the toolbar to restore every group at once.
Every collapse and expand is tracked in the undo history (Ctrl+Z / Ctrl+Y).
Visual editor
The Editor tab provides visual-only tools that never modify your .rpy source:
| Tool | How to use |
|---|---|
| Custom Arrow | Click button → click start node → click end node |
| Text Annotation | Click button → click canvas → type text |
| Highlight Nodes | Click button → click nodes to toggle yellow highlight |
| Hide Elements | Click button → click a node to hide temporarily |
| Edit Display Name | Click button → click node → enter custom label |
| Delete | Select arrow or annotation → press Delete |
| Clear All Graphics | Removes all visual overlays |
Filters
The Filter tab lets you show or hide nodes by type: Entry, Narrative, Containers, Routing, System, Exit, Unknown. Filter changes are tracked in undo/redo and saved with layout slots.
Save slots
Save up to 10 named layout slots. Each preserves node positions, filter state, and all graphics. Slots persist across VS Code restarts.
Export
From the Settings tab:
| Format | Notes |
|---|---|
| PNG | 1ז4× scale; Ctrl+Shift+E shortcut |
| SVG | Vector output, editable in design tools |
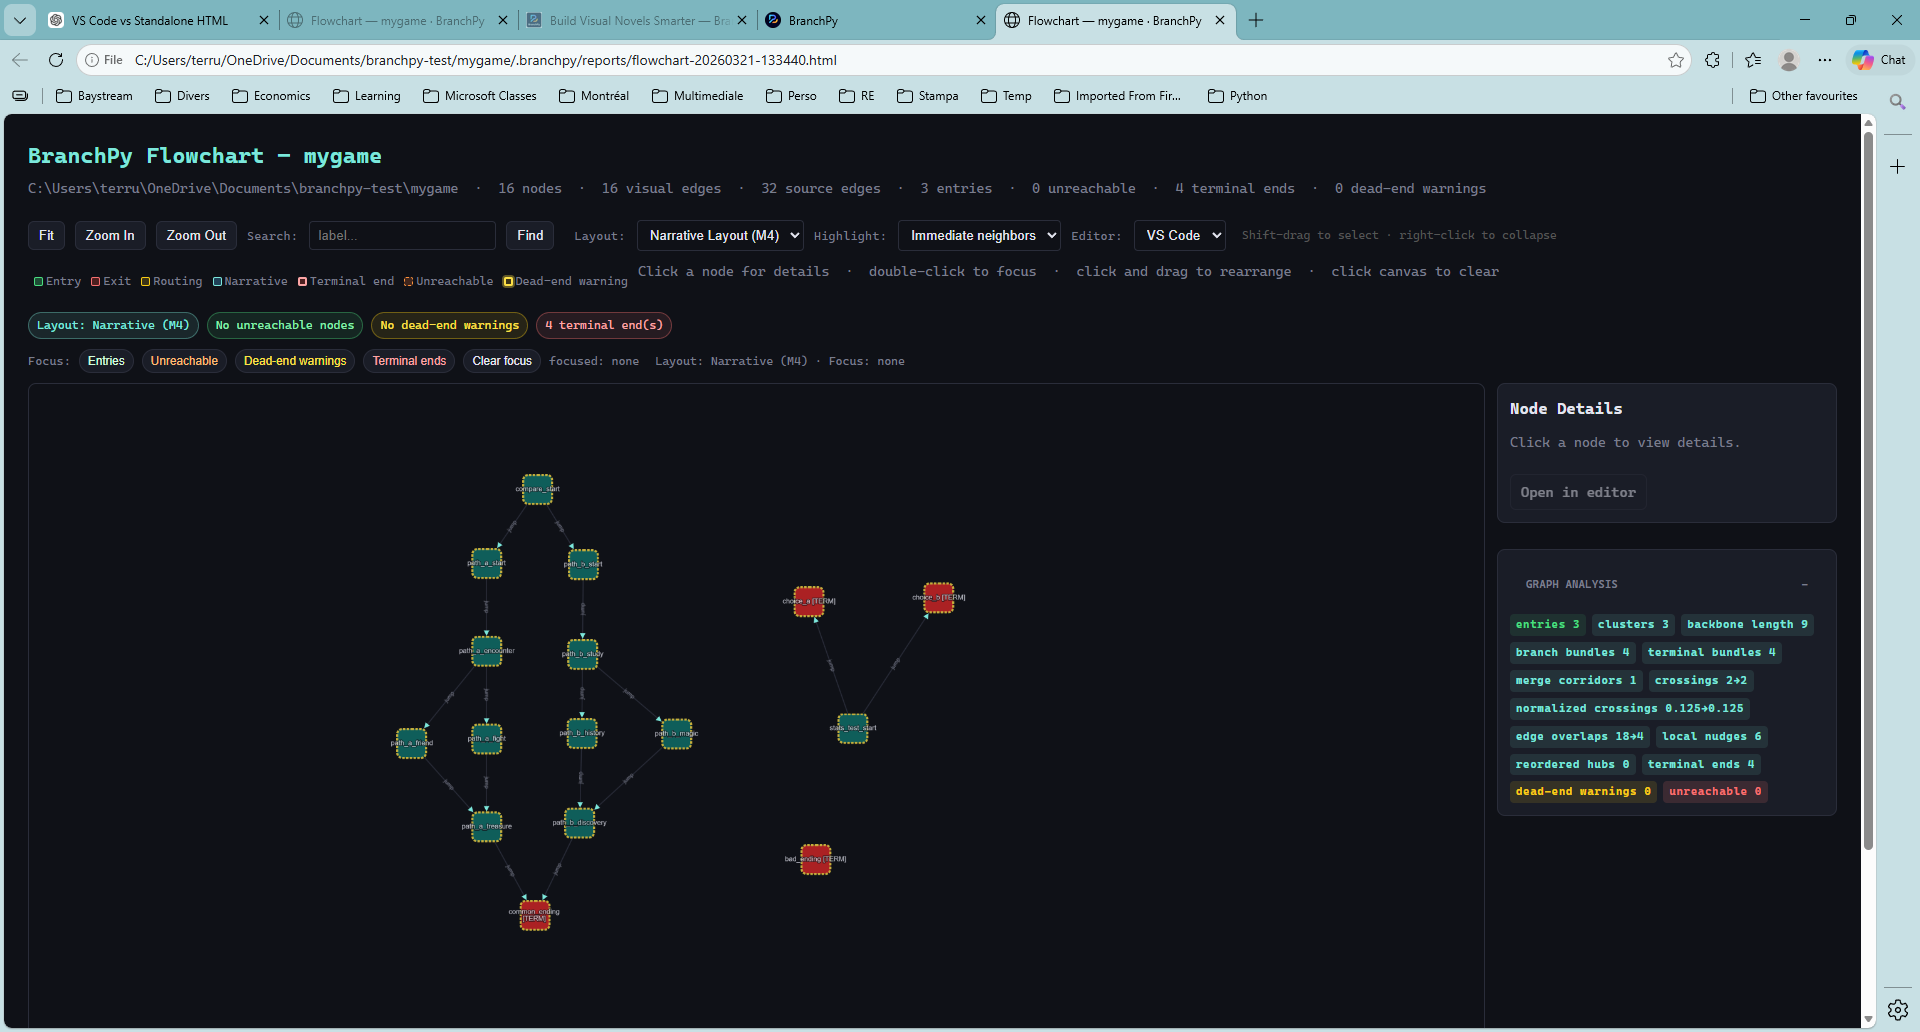
| Generate HTML | Self-contained browser export for sharing |
Undo / Redo history
The History tab shows a timestamped log of every operation. Jump-to-State lets you restore any past snapshot. Ctrl+Z / Ctrl+Y work across arrows, annotations, highlights, labels, hidden nodes, filters, positions, and collapse/expand.
Standalone HTML
Generate HTML exports a self-contained interactive flowchart that includes grouping, collapsing, node details, and the label-to-editor link — all working in a regular browser with no BranchPy installed.
Tier summary
| Feature | Required tier |
|---|---|
| Interactive graph (all node/edge types) | Ren’Py Free |
| Multi-select, grouping, collapsing | Ren’Py Free |
| Filters, save slots, undo/redo history | Ren’Py Free |
| Visual editor (arrows, annotations, highlights) | Ren’Py Free |
| SCR / RBI narrative signal pills (D9 required) | Ren’Py Free |
| PNG / SVG export | Ren’Py Free |
| Standalone HTML export | Ren’Py Free |
| Custom style templates | Ren’Py Free |
Learn more: Flowchart (base) · Technical/ui