This page explains how BranchPy generates and displays the Flowchart and Flowchart+ views after running an Analyze pass.
Flowchart visualizes your Ren’Py game’s branching structure so you can immediately see dead ends, unreachable labels, and narrative logic issues — without reading a single line of source code. Every label, jump, call, and menu branch becomes a node you can explore and inspect.
Where you use it
| Environment | What you get |
|---|---|
| VS Code panel | Live interactive graph — click any node to jump to its source, edit visuals, group and collapse paths, save layouts across sessions |
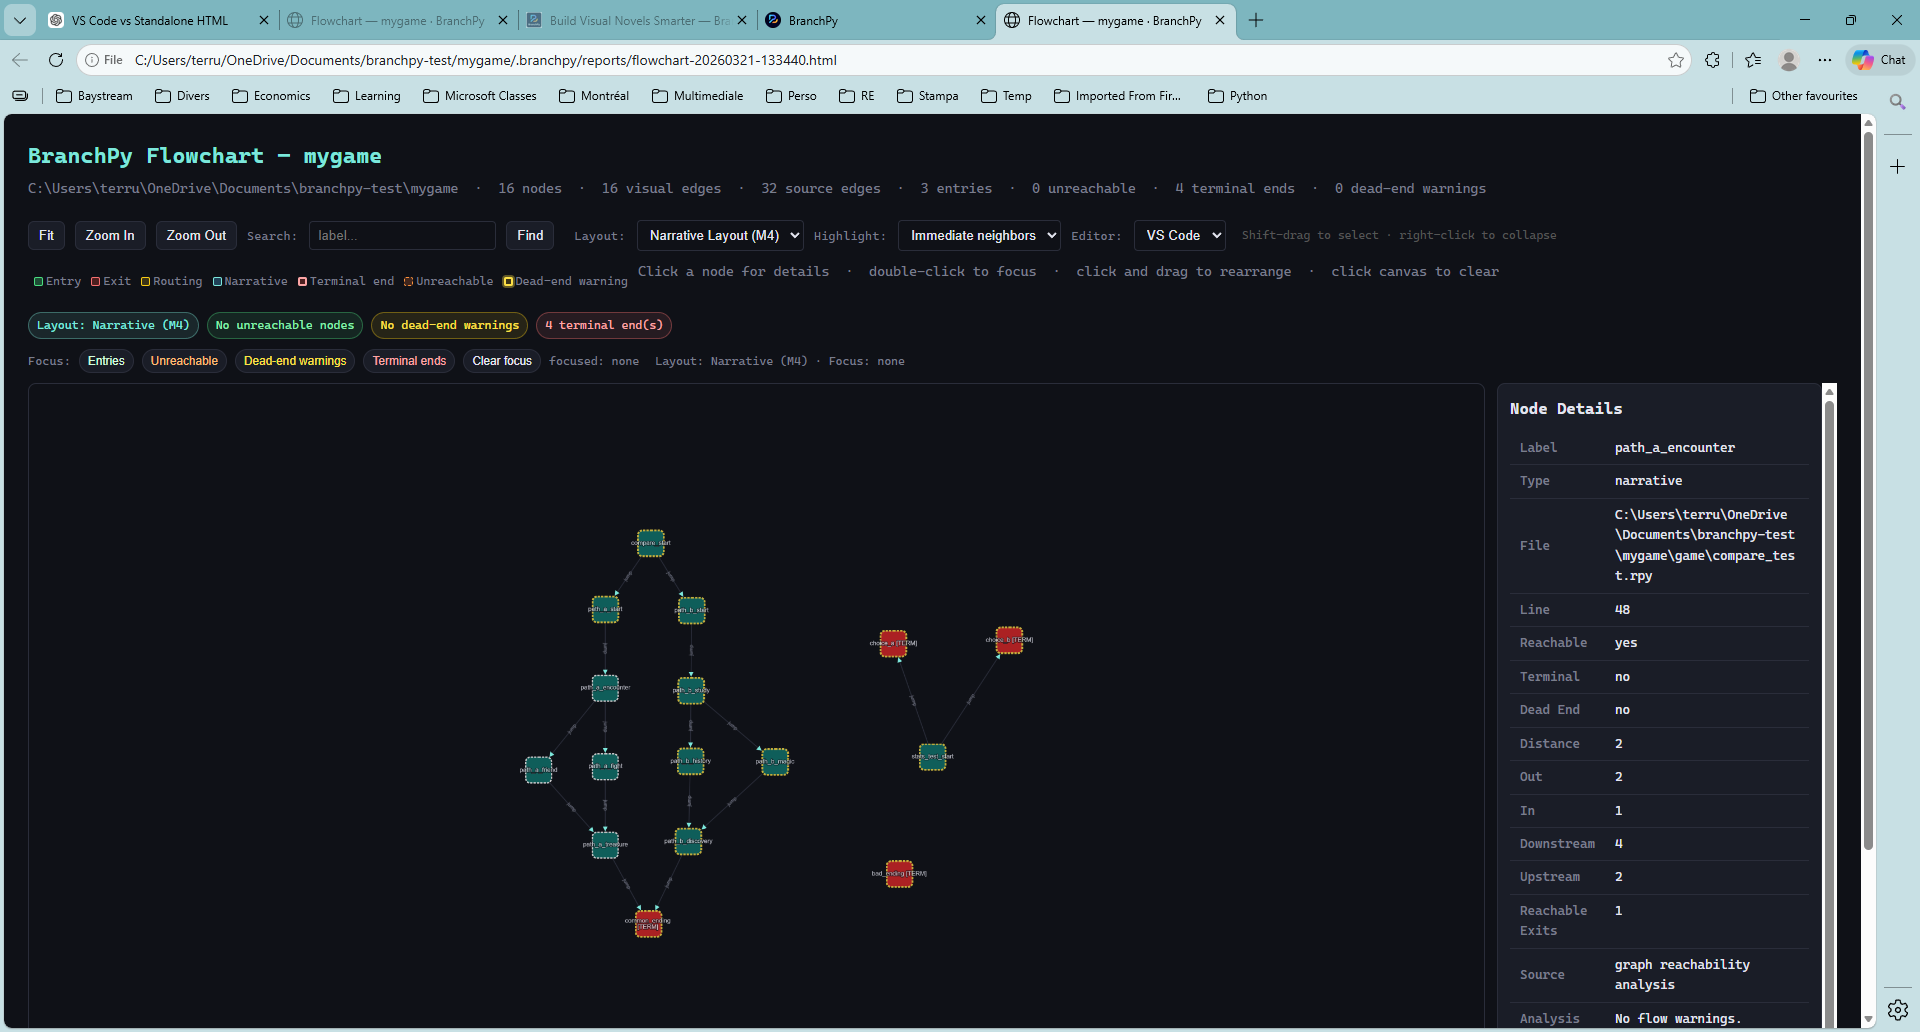
| Standalone HTML | Self-contained export you can open in any browser or share with your team — no BranchPy or VS Code required |
Both are available on all tiers. The VS Code panel is the full experience; HTML is the shareable snapshot.
Pre-release note: Flowchart Plus is currently available to all tiers. When BranchPy reaches general release, Plus will require a Ren’Py Pro license. Standard Flowchart remains on Ren’Py Free.
One command, two modes
Flowchart is one feature that runs in two modes. You always use the same command. The mode is determined by your account tier.
| Mode | Opens when |
|---|---|
| Standard | Free (unregistered) tier — full interactive graph, all layout and export features |
| Plus | Any registered account (Ren’Py Free and above) — full interactive graph with all layout features, plus compatibility status view (READY / STALE / BLOCKED), SCR / RBI signals, Semantic Lanes filter panel, and edge certainty threshold |
There is no separate command and no configuration needed. BranchPy checks your license tier when you open Flowchart and routes accordingly. If your account is registered (any tier), the panel opens as Flowchart+ with the full interactive graph and additional signals — compatibility status, SCR/RBI signal pills, Semantic Lanes filter, edge certainty threshold, and Narrative layout selector.
Licensing: Standard Flowchart is included with Ren’Py Free. Flowchart Plus requires Ren’Py Pro. During the current pre-release period, Plus is available to all tiers.
What Plus adds
| Capability | Standard (Free) | Plus (Pro) |
|---|---|---|
| Interactive graph (all node/edge types) | ✅ | ✅ |
| Pan, zoom, minimap, node search | ✅ | ✅ |
| Node detail popup, Open in Editor | ✅ | ✅ |
| Filters by node type | ✅ | ✅ |
| Multi-select, grouping, collapsing | ✅ | ✅ |
| Visual editor (arrows, annotations, highlights) | ✅ | ✅ |
| Layout save slots, undo/redo history | ✅ | ✅ |
| PNG / SVG / HTML export | ✅ | ✅ |
| Compatibility status view (READY / STALE / BLOCKED) | ❌ | ✅ |
| SCR — Structural Complexity Rating | ❌ | ✅ |
| RBI — Route Balance Index | ❌ | ✅ |
| Narrative layout mode selector | ❌ | ✅ |
| Narrative analysis panel | ❌ | ✅ |
| Semantic Lanes filter panel (A / B / C) | ❌ | ✅ |
| Edge certainty threshold (All / Weak+ / Strong+ / Proven) | ❌ | ✅ |
| D25 Narrative Block Layout | ❌ | ✅ |
When do I need Plus?
For most projects, Standard Flowchart is enough to get started. Here is a practical signal for when Plus becomes valuable:
| Your situation | What you need |
|---|---|
| Small project, simple branching | Standard — fast, clear, no setup needed |
| Multiple files, routes diverging in many directions | Plus — SCR flags structural complexity before it becomes a problem |
| Debugging unexpected behavior or broken logic | Plus — narrative signals show where the structure is overloaded or unbalanced |
| Balancing play time across branches | Plus — RBI tells you if routes are disproportionate |
| Preparing for a playtest or co-author review | Plus — Narrative layout and signal pills give a faster health check |
| Exporting a shareable map | Standard or Plus — HTML / SVG / PNG export available in both; use HTML standalone export for 800 + node graphs |
In short: Standard gives you the map. Plus tells you what the map is trying to tell you.
When to use Flowchart
- After Analyze, to understand your narrative’s overall shape at a glance.
- To spot dead ends, disconnected areas, or unexpected branch structure before playtesting.
- To navigate quickly to any label in your source without a text search.
- To prepare a visual map for a sprint review, design discussion, or co-author handoff.
How to open
- Run Analyze from the BranchPy Control Center.
- Wait for the report to finish.
- Click Open Flowchart in the report or the control center.
To get Plus mode, enable D9 Narrative Analysis in your Analyze settings before running. For a full Plus-eligible run from the CLI:
branchpy --project <path> analyze
branchpy --project <path> pilot
branchpy omega --project-root <path>
Flowchart always reflects the last completed Analyze run. If you edit
.rpyfiles afterwards, re-run Analyze first, then reopen the panel to pick up the latest data. The timestamp shown at the top tells you when the analysis was taken.
Opening a Flowchart after restart
The full interactive graph requires a session run — an Analyze that completed during the current VS Code session. The Control Center button is labelled Open Session Flowchart to make this clear.
| Situation | What happens |
|---|---|
| Analyze ran this session | Flowchart opens immediately with the full graph |
| VS Code was restarted (no session run yet) | A dialog appears with two options |
When the dialog appears, you have two choices:
- Run Flowchart — triggers a fresh Analyze run and opens the graph when complete
- Open Last Summary — opens a read-only text summary from the previous run without re-running
The Open Last Summary path is always available and requires no re-run. Use it when you only want to review counts and metrics from the last run without loading a visual graph.
Why session-scoped? The interactive graph is generated fresh during each Analyze run. BranchPy does not persist the full graph between VS Code sessions because graph data can be large and may be stale. The summary is always available from disk; the graph requires a live run.
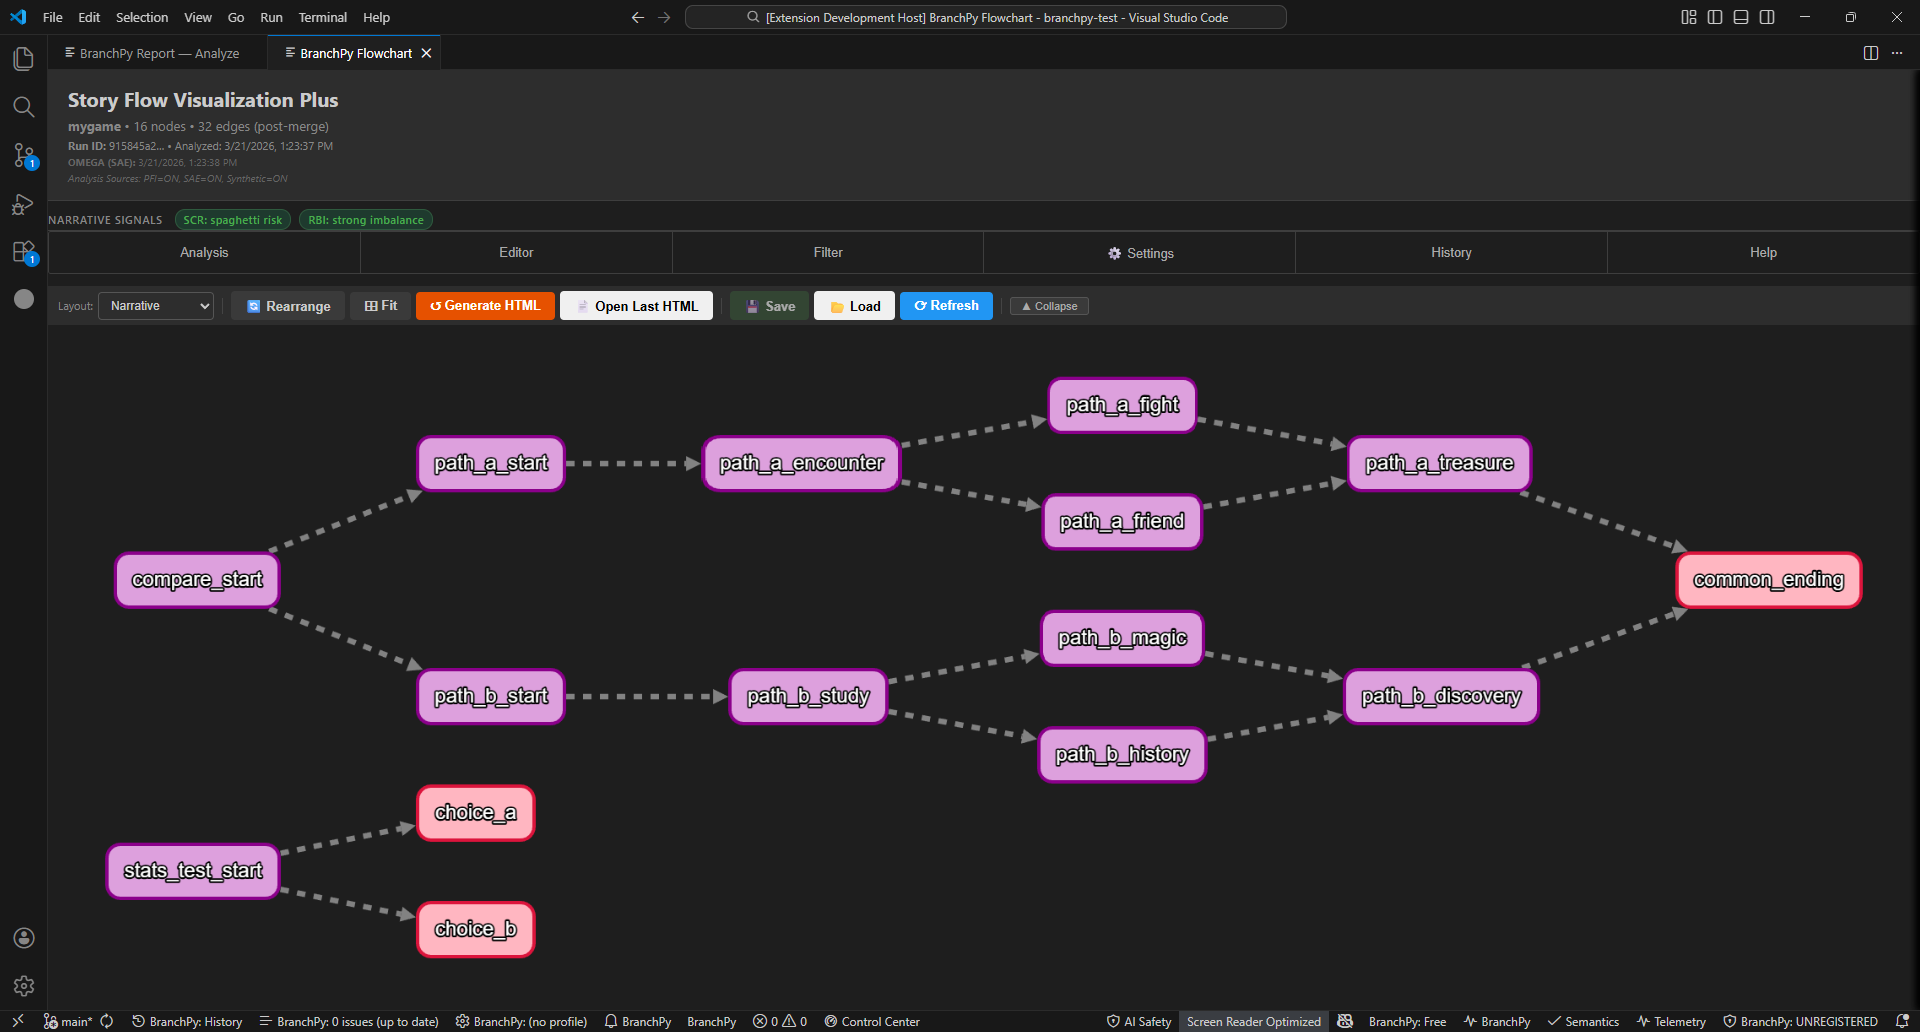
Navigating the panel
The panel is divided into a graph canvas (centre) and a control panel (right, accessed via tabs).
| Tab | What it contains |
|---|---|
| Analysis | Node-type counts, SCR/RBI narrative signals (Plus only), Hotspots, Fit Graph |
| Editor | Visual tools: custom arrows, text annotations, highlights, hide, display names |
| Filter | Show/hide nodes by type (Entry, Narrative, Containers, Routing, System, Exit, Unknown) |
| Settings | Export (PNG/SVG), display options, custom node style profiles |
| History | Timestamped undo/redo stack with Jump-to-State |
| Help | In-panel searchable reference |
Edge types
Each edge in the graph has a kind — a classification that describes the Ren’Py statement that produced it. The Edge Style Legend in the control panel lists all kinds with filterable checkboxes.
Semantic edge families (CALL / RETURN)
These two edge kinds carry an additional line-color to make call/return pairs visually distinct:
| Kind | Colour | Meaning |
|---|---|---|
| CALL | Teal (#2DD4BF) |
A call label_name statement — enters a subroutine |
| RETURN | Violet dashed (#A78BFA) |
A return statement — resumes after a call completes |
Screen action edges (D19)
Statements inside screen blocks that trigger navigation. These use dash-pattern only — no separate line-colour:
| Kind | Dash pattern | Meaning |
|---|---|---|
| screen_jump | Long dash (7, 3) | Jump("label") inside a screen button action — static literal target |
| screen_call | Medium dash (5, 2) | Call("label") inside a screen button action — static literal target |
| screen_return | Short dash (2, 3) | Return() inside a screen block — runtime-resolved, shown as edge to ? node |
Python literal transfer edges (D20)
Navigation calls inside $ or python: blocks. These also use dash-pattern only:
| Kind | Dash pattern | Meaning |
|---|---|---|
| python_jump | Long dash (8, 2) | renpy.jump("label") in a Python block — static literal target |
| python_call | Medium dash (5, 3) | renpy.call("label") in a Python block — static literal target |
| python_return | Short dash (2, 4) | renpy.return_statement() in a Python block — runtime-resolved, shown as edge to ? node |
Hover over any edge to see its kind, certainty tier, and any condition expression.
Inspecting a label
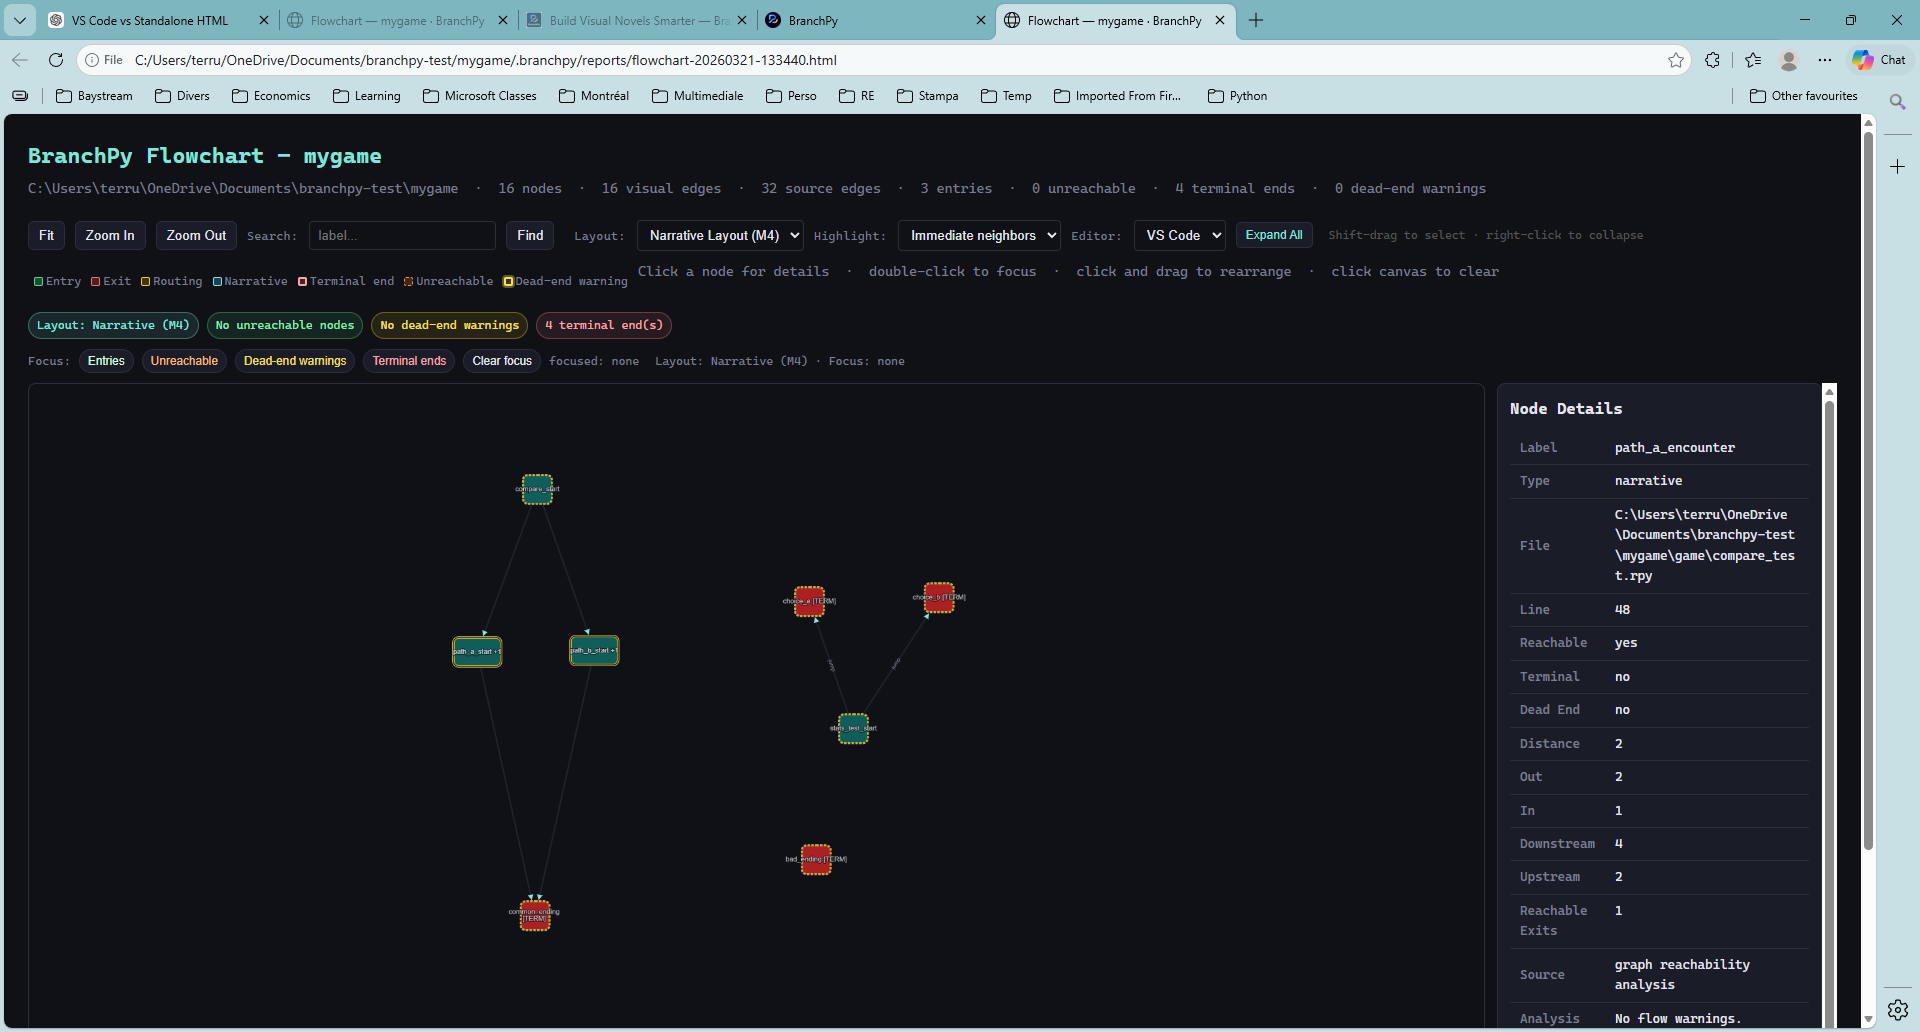
Click any node to open its detail popup.
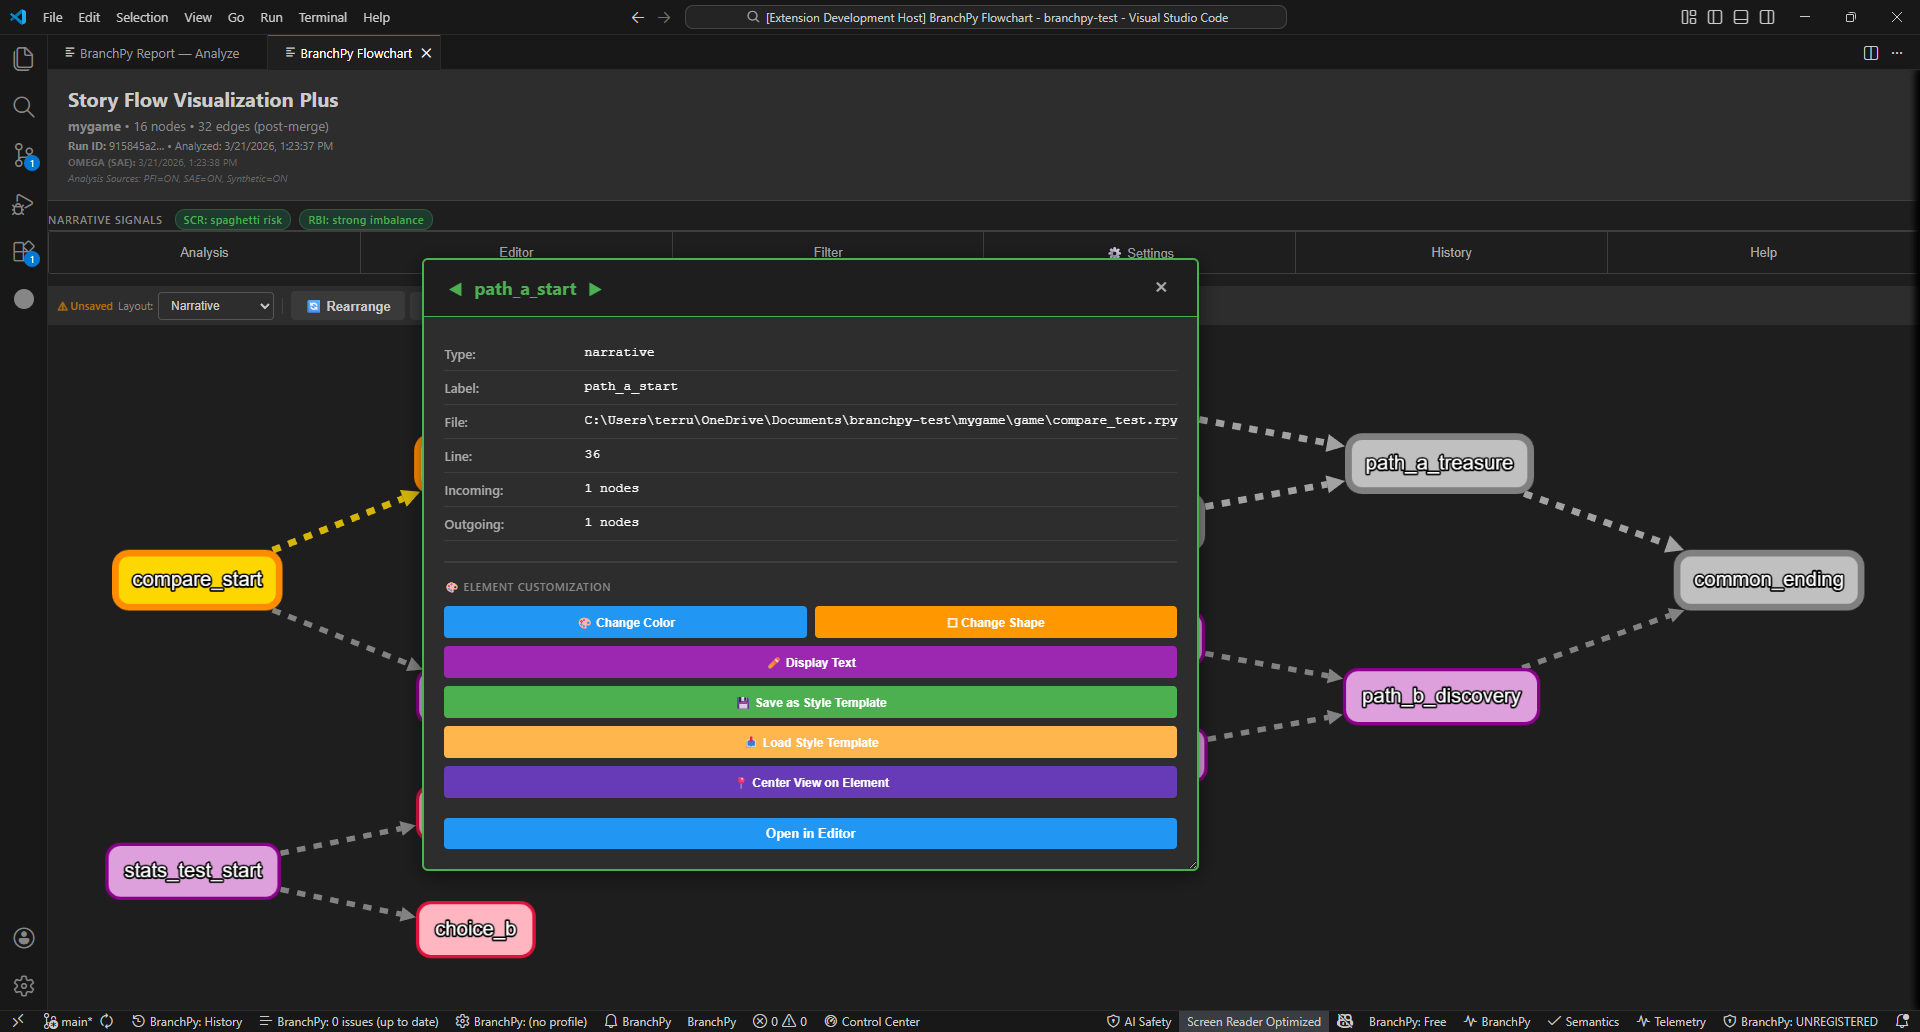
The popup shows:
- Type — Entry, Narrative, Routing, System, Exit, Unknown
- File and line — exact location in your
.rpysource - Incoming / Outgoing — edge counts
- Open in Editor — jumps straight to that label in VS Code
- Element Customisation — change colour, shape, display name, or save a reusable style template
Multi-selecting labels
Hold Shift and drag to draw a selection box, or hold Ctrl and click to toggle individual nodes. The selection count appears in the Analysis tab.
With nodes selected you can:
- Highlight all (yellow overlay)
- Hide all (temporarily remove from view)
- Fit view to the selection
- Collapse into a group node (see below)
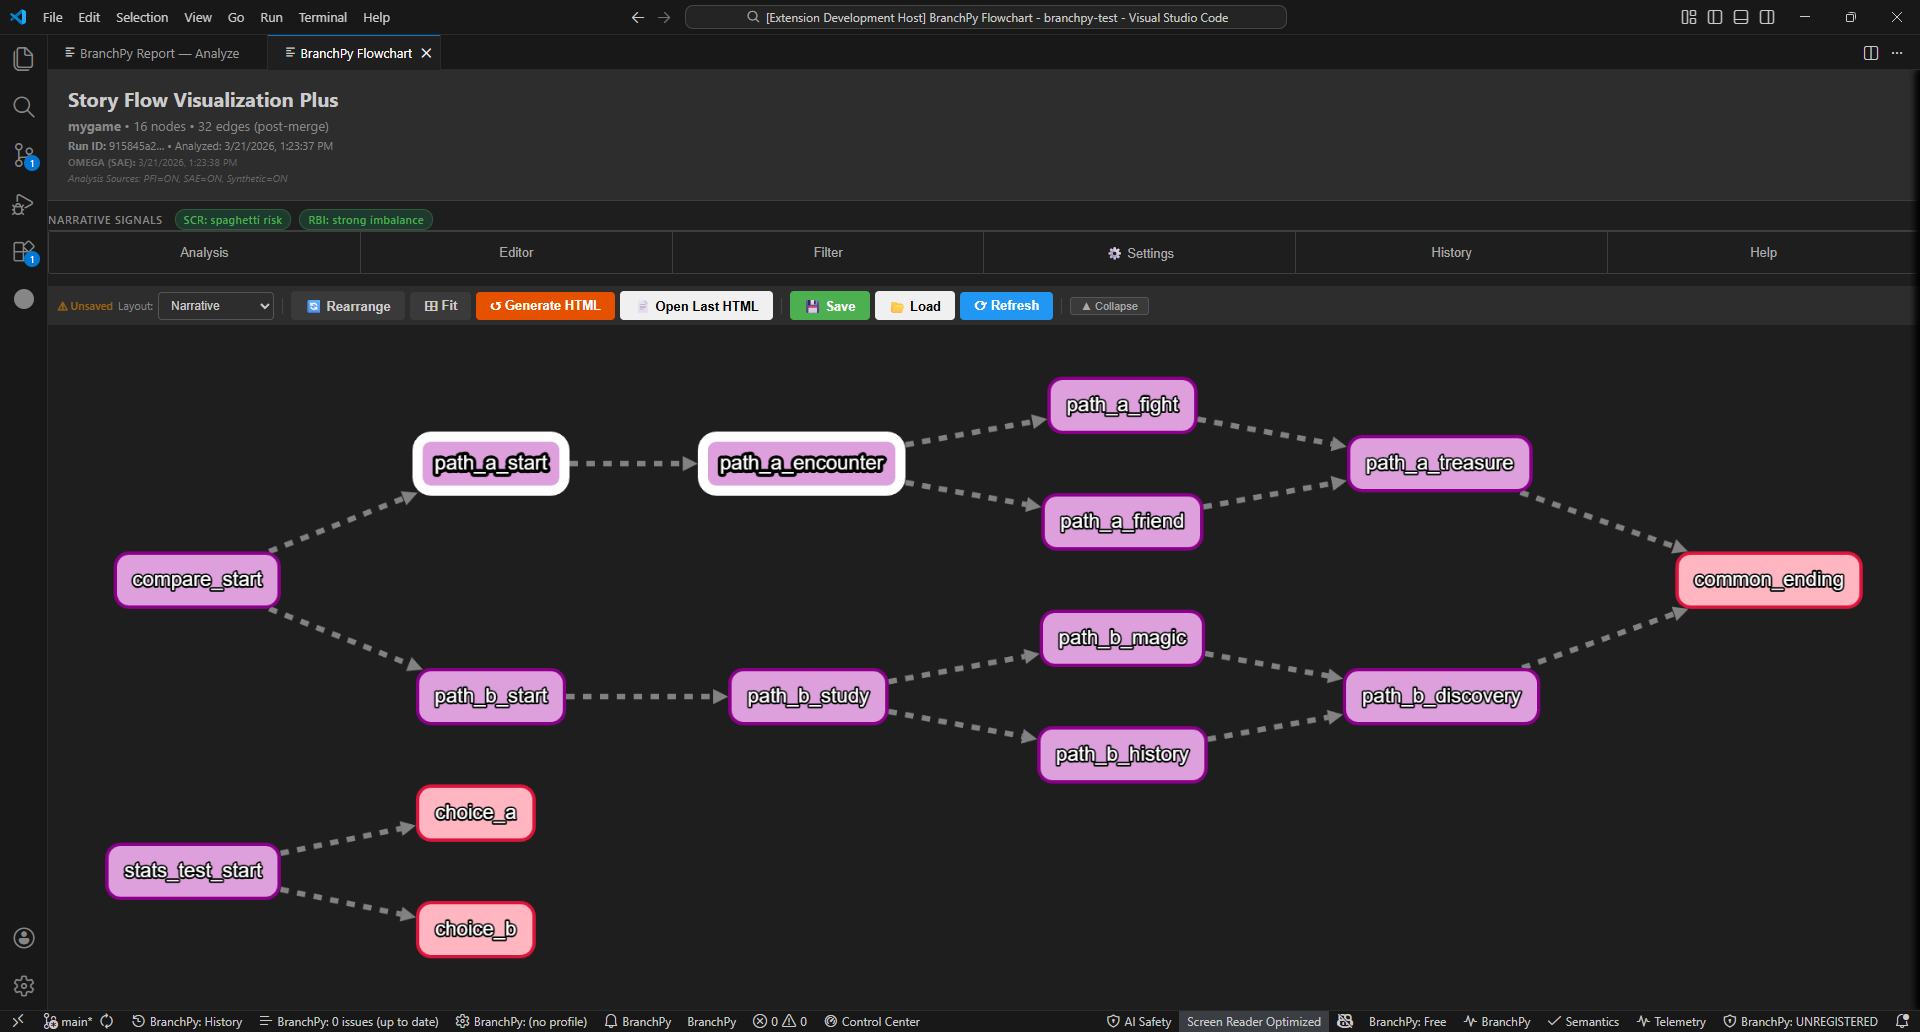
Grouping and collapsing labels
Any set of selected labels can be folded into a compact group node to reduce clutter on busy graphs. All edges reroute automatically. This is a visual-only operation — your .rpy source is never changed.
To collapse: Select 2+ nodes, then right-click → Collapse Highlighted Nodes, or click the ▲ Collapse toolbar button.
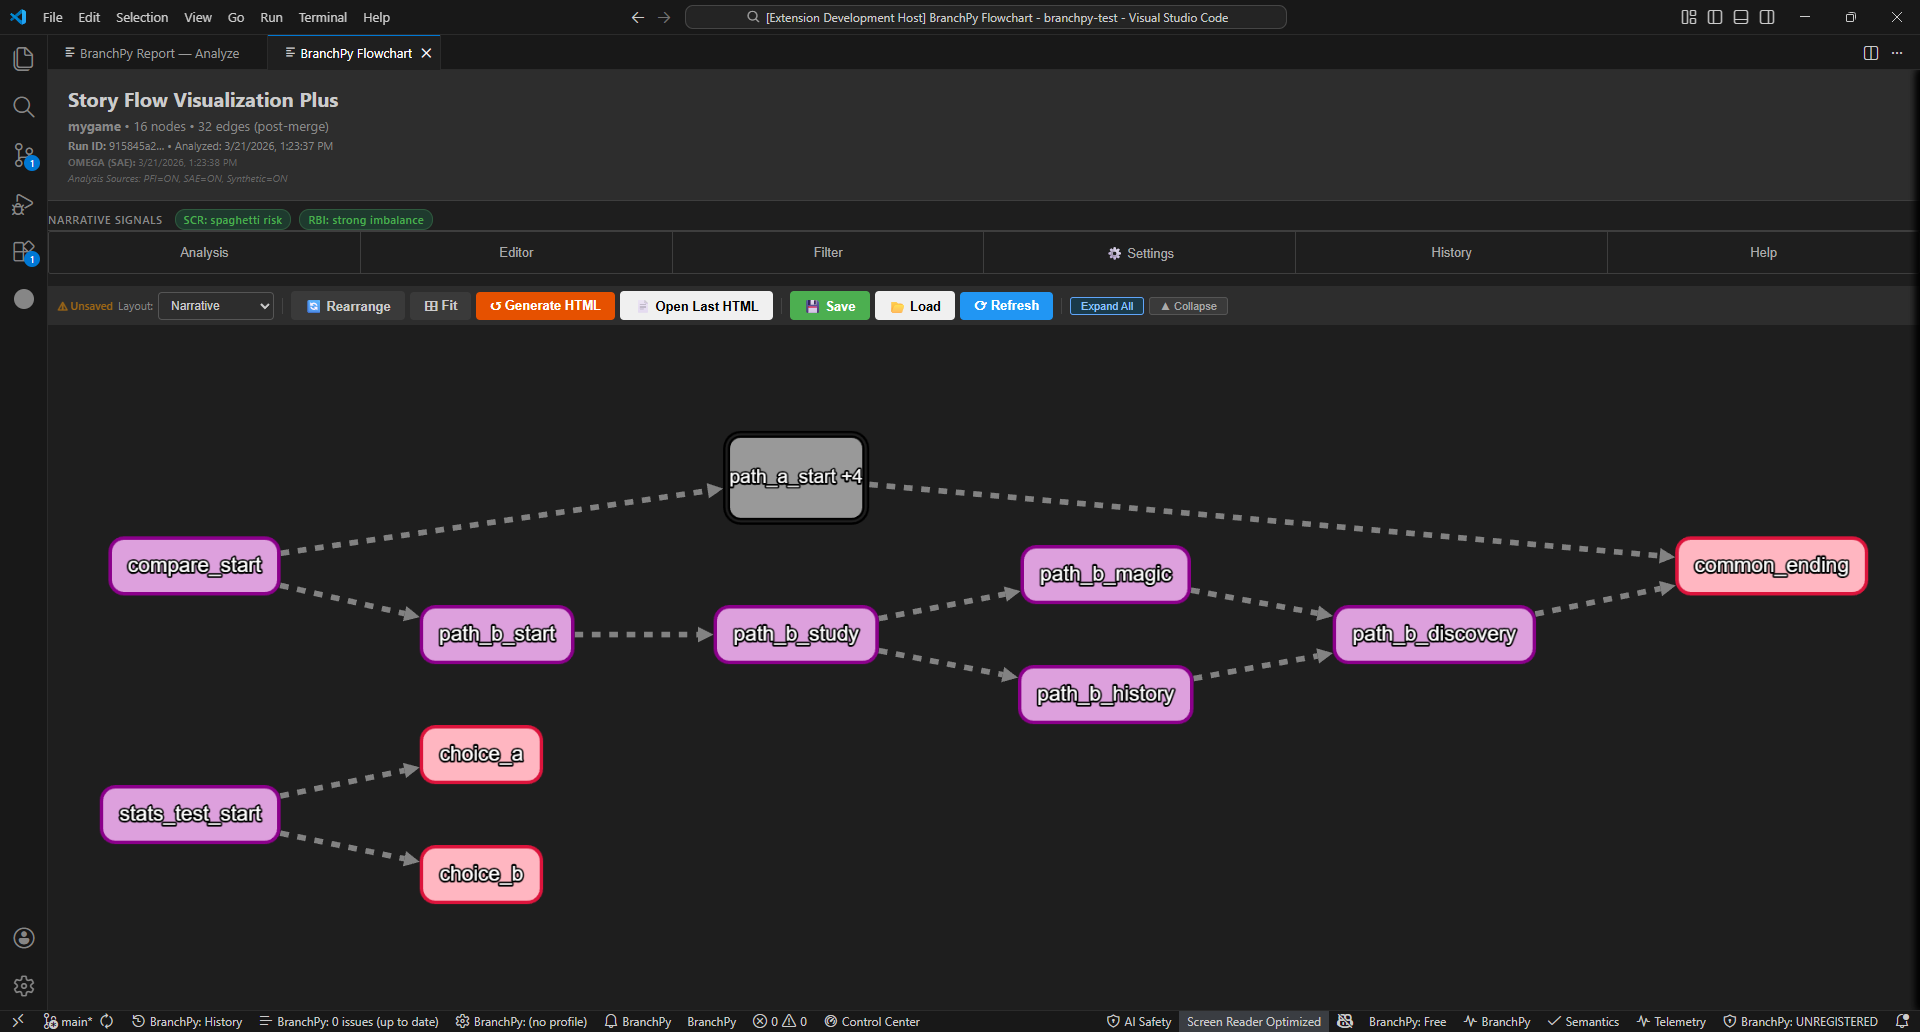
The group node is labelled name +N where N is the count of hidden labels. You can collapse multiple independent paths simultaneously.
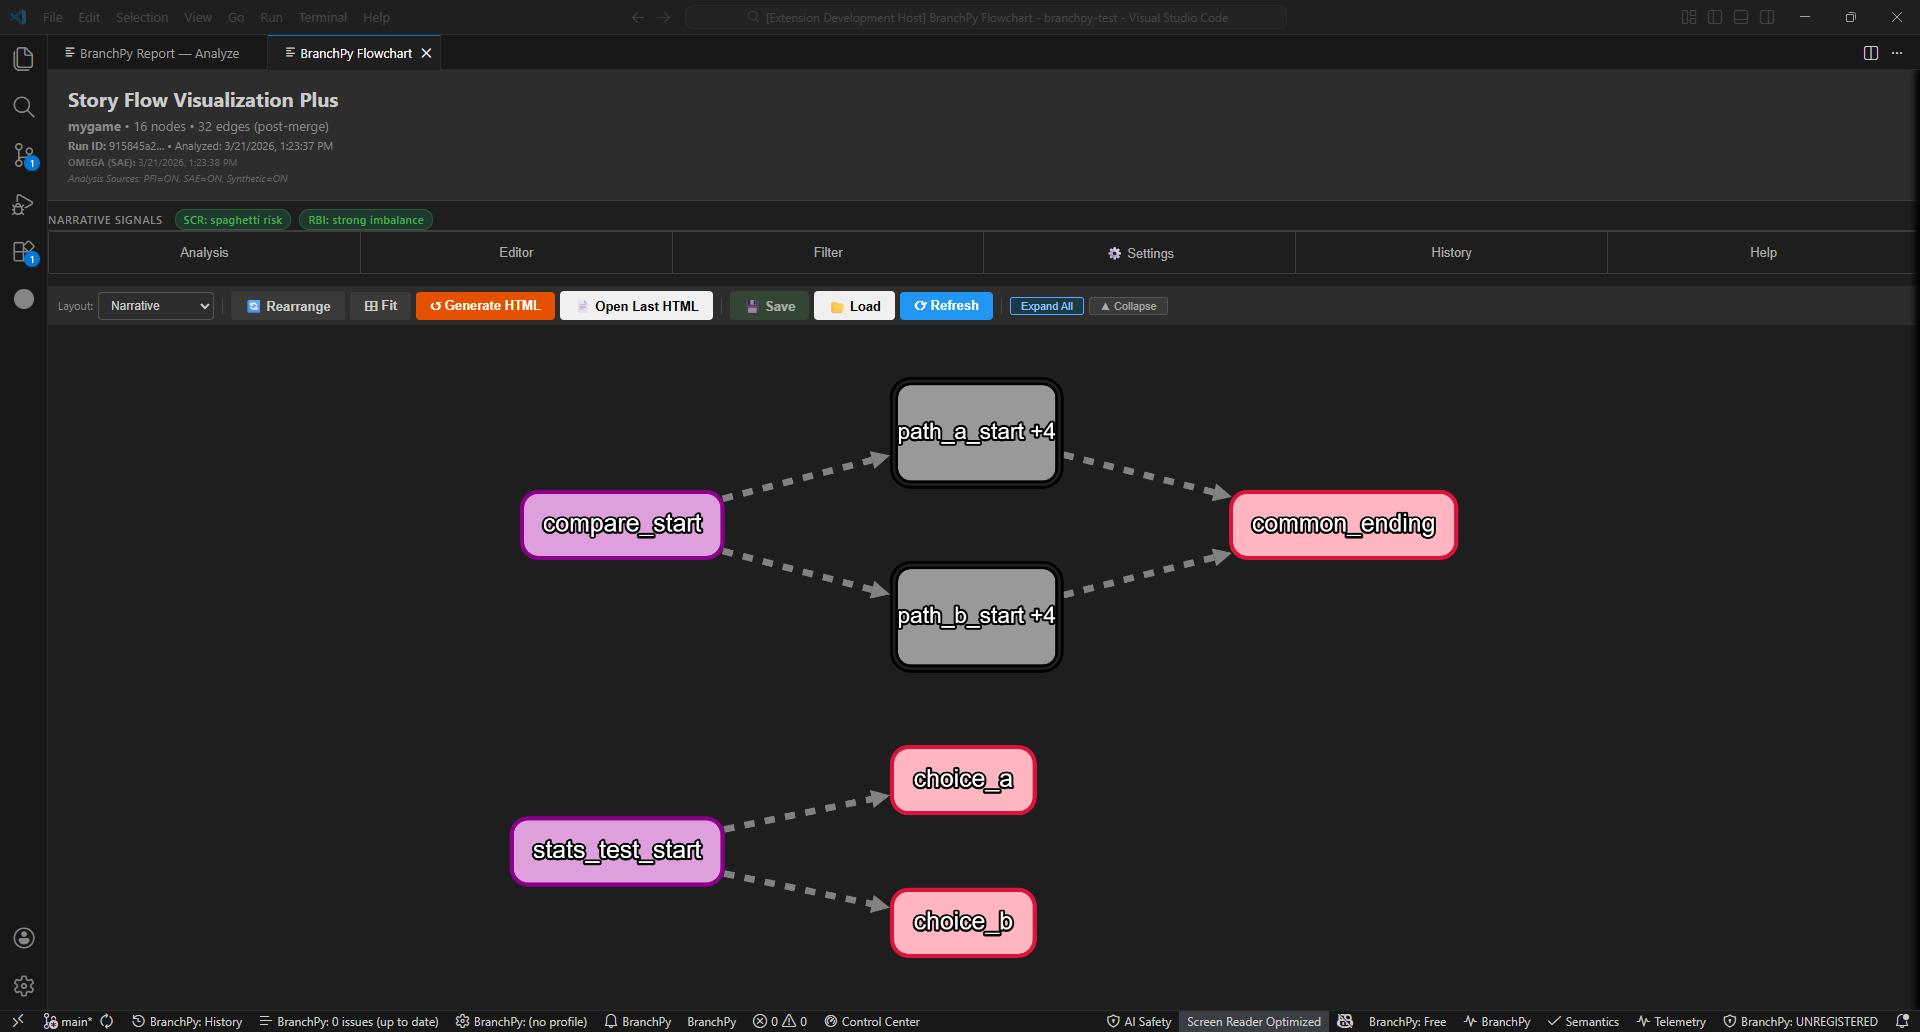
Nested groups: Collapse a group node together with other nodes to fold further. The label stacks the counts — for example path_a_start +4 +1.
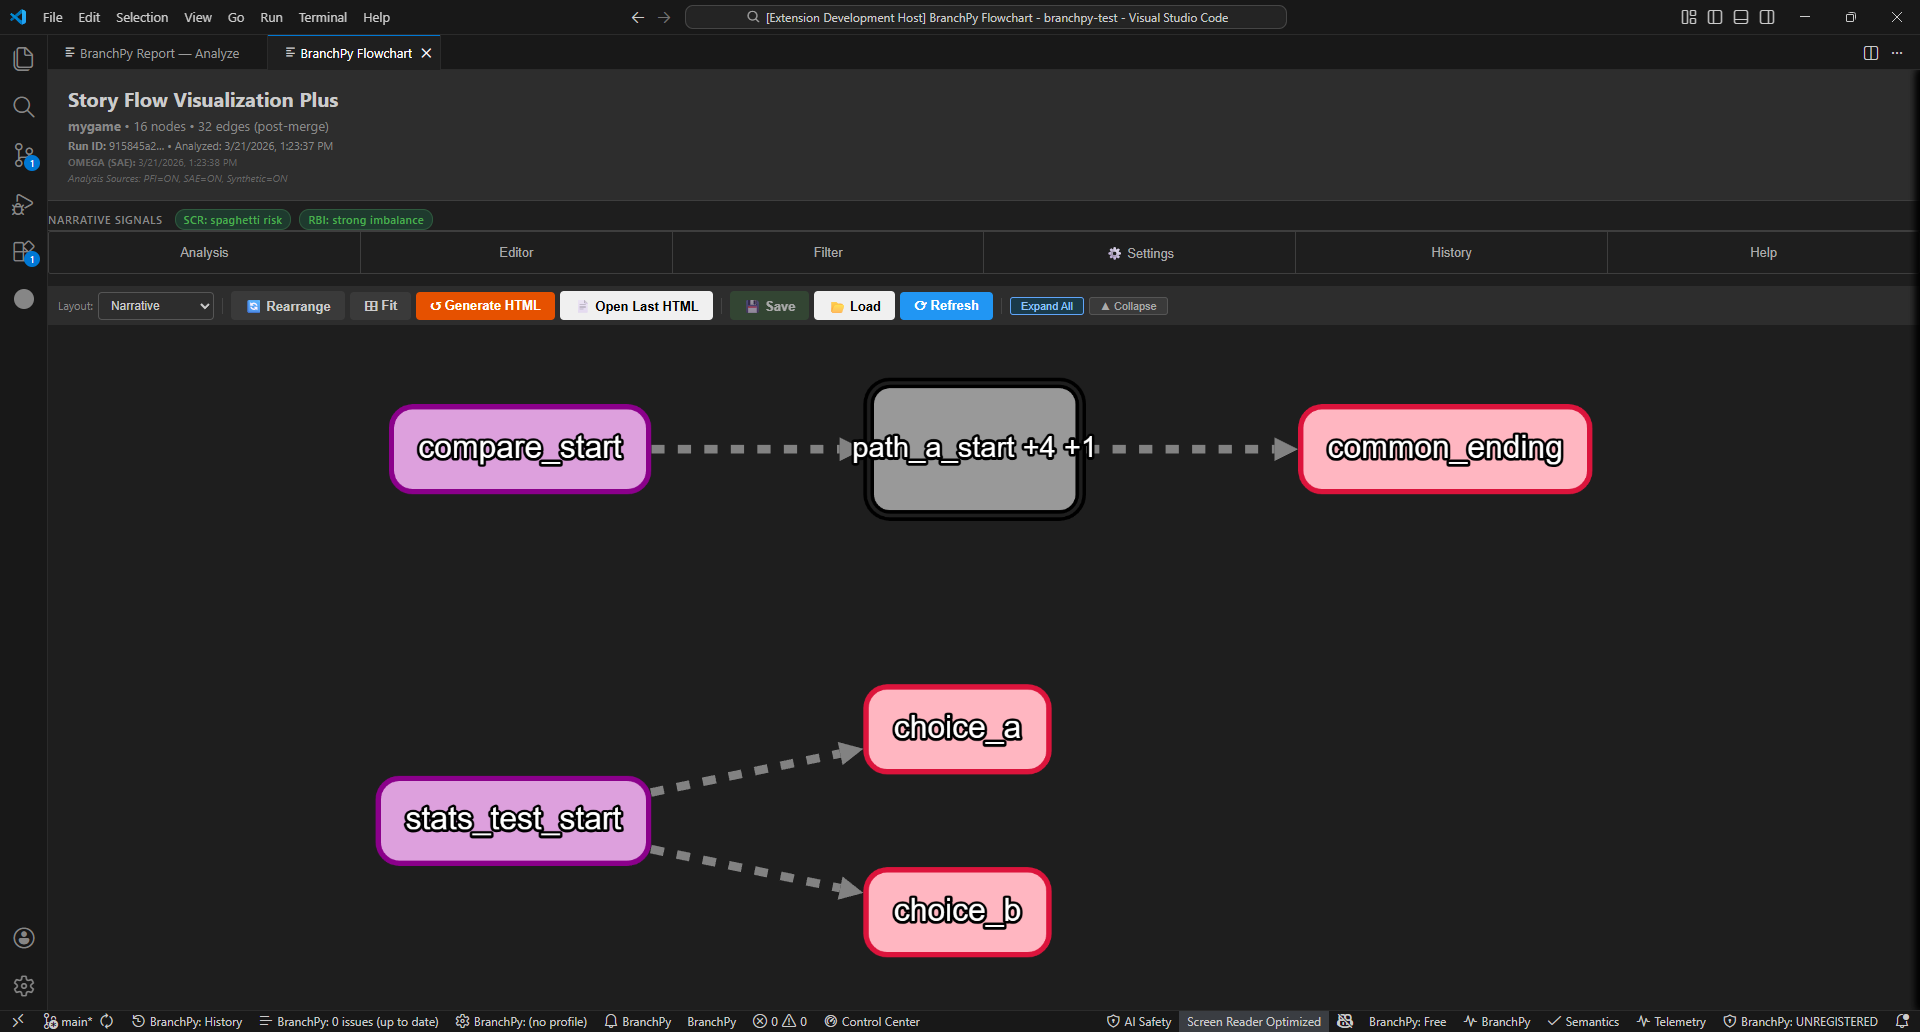
To expand: Right-click a group node → Expand This Group. Or click Expand All in the toolbar to restore every group at once.

Every collapse and expand is tracked in the undo history — Ctrl+Z / Ctrl+Y work as expected.
Visual editor
The Editor tab provides tools that never modify your .rpy source:
| Tool | How to use |
|---|---|
| Custom Arrow | Click button → click start node → click end node |
| Text Annotation | Click button → click canvas → type text |
| Highlight Nodes | Click button → click nodes to toggle yellow overlay |
| Hide Elements | Click button → click a node to hide temporarily |
| Edit Display Name | Click button → click node → enter custom label |
| Delete | Select arrow or annotation → press Delete |
| Clear All Graphics | Removes all visual overlays |
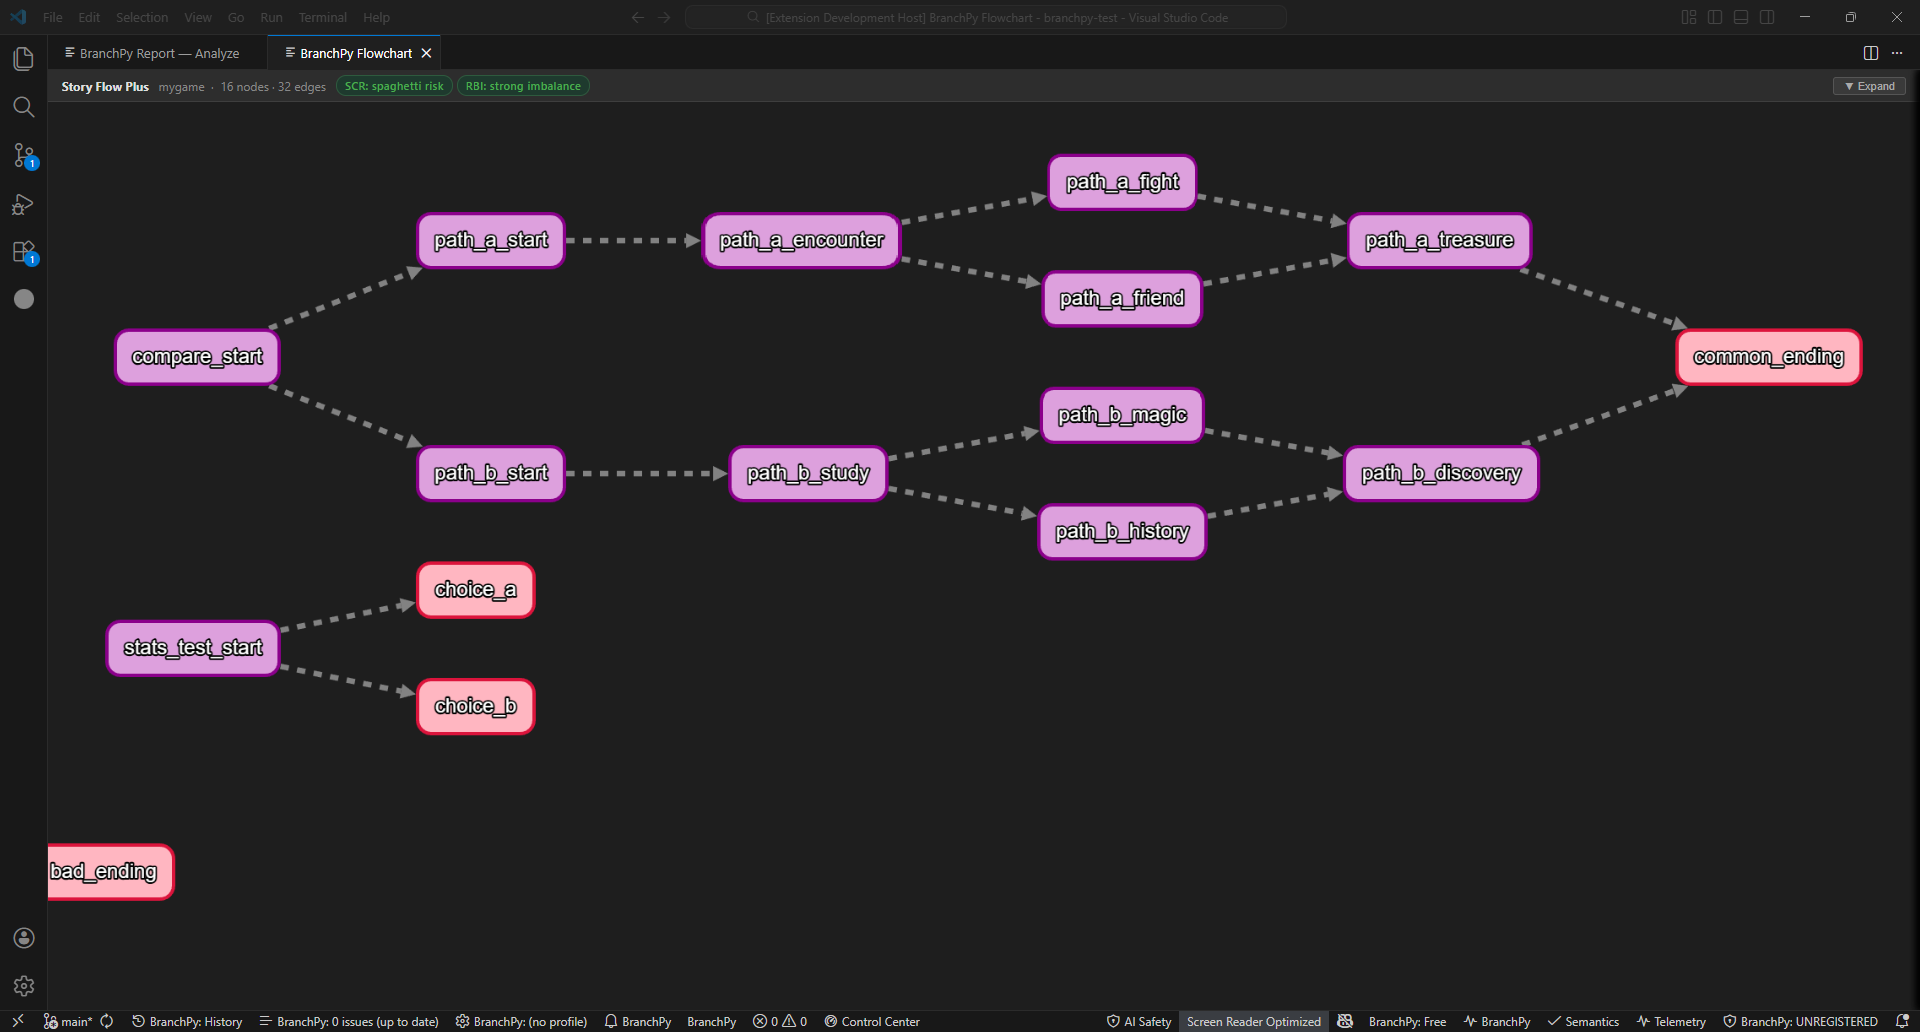
Narrative signals — Plus only
When Flowchart opens in Plus mode, two compact pills appear immediately below the project name:
| Pill | What it measures |
|---|---|
| SCR — Structural Complexity Rating | How structurally complex your story is. Bands: extremely clean · healthy · busy · difficult · spaghetti risk |
| RBI — Route Balance Index | How evenly your story’s routes are distributed. Bands: balanced · mild imbalance · strong imbalance · extreme imbalance |
These values come directly from D9 Narrative Analysis — the same values shown in analyze --summary and analyze --html reports. Seeing them inline in the graph means you don’t need to switch to the text report for a structural health check.
Narrative layout mode (Plus only): a Classic | Narrative selector appears in the panel header. Classic is the default. Narrative mode switches to a backend-computed layout using semantic summary positions, and activates the Narrative analysis panel showing fallback_mode, cleanup_tier, performance.node_count, and coordinate determinism data.
Semantic Lanes — Plus only
Every node is assigned to a Semantic Lane based on its role in the narrative structure. The lane is a D13 classification computed by the backend — it is not a visual grouping you apply manually.
| Lane | Label | What it contains |
|---|---|---|
| A | Main spine | The primary story path — backbone labels that every playthrough passes through |
| B | Call detours | Sub-labels entered via call / Call() / renpy.call() — optional side branches that return to the spine |
| C | Peripheral / synthetic | Dead ends, unreachable labels, ? target-resolution nodes, and other structural utilities |
The Semantic Lanes section of the control panel shows three checkboxes (A, B, C) each with a live node count. Uncheck a lane to hide all nodes and edges classified in that lane. This is especially useful on large graphs where Lane C (peripheral) adds visual noise you want to reduce temporarily.
Edge certainty threshold — Plus only
Each edge is assigned a certainty tier by the backend. The tier reflects how confidently BranchPy knows this edge will execute at runtime.
| Tier | Colour | Assigned when |
|---|---|---|
| Proven | Teal (#4EC9B0) |
Explicit jump, call, or sequential fallthrough — statically guaranteed |
| Strong | Blue (#4FC1FF) |
PFI-resolved — resolved via persistent flow inference, high confidence |
| Weak | Orange (#CE9178) |
SAE-inferred or heuristic continuation — plausible but not proven |
| Speculative | Grey (#808080) |
Unresolved dynamic dispatch or ambiguous condition — may or may not execute |
The Edge Certainty section of the control panel shows a four-tier legend with per-tier checkboxes. Use the threshold dropdown to quickly filter to a minimum confidence level:
| Setting | Edges shown |
|---|---|
| All | Every edge including Speculative |
| Weak+ | Proven, Strong, and Weak — Speculative hidden |
| Strong+ | Proven and Strong only |
| Proven | Statically certain edges only — strictest view |
If All and Proven show the same count, every edge in this graph is statically proven — typical for simple stories with no dynamic dispatch. If Proven is lower than All, the difference represents inferred or speculative connections worth reviewing. Double-click any edge to see its exact tier and reason.
Saving and loading layouts
Use the 💾 Save / 📂 Load toolbar buttons to manage up to 10 named layout slots. Each slot preserves:
- Node positions
- Filter state (which types are visible)
- All graphics (custom arrows, annotations, highlights, display names)
- Visualization settings
Slots persist across VS Code restarts.
Export
From the Settings tab:
| Format | Notes |
|---|---|
| PNG | 1ז4× scale; Ctrl+Shift+E shortcut |
| SVG | Vector output, editable in design tools |
| Generate HTML | Self-contained browser export for sharing |
D25 Narrative Block Layout — large graph note: For graphs of 800 + nodes (MAS-scale stories), the VS Code panel renders vertically due to layout algorithm complexity. For the full Narrative Block layout on large graphs, use the HTML standalone export:
branchpy --project <path> flowchart --out <file>.html
From the CLI:
branchpy --project <path> flowchart --out <file>.htmlStandalone HTML report
The HTML export includes grouping, collapsing, node details, and the label-to-editor link — all working in any modern browser with no VS Code or BranchPy installed.
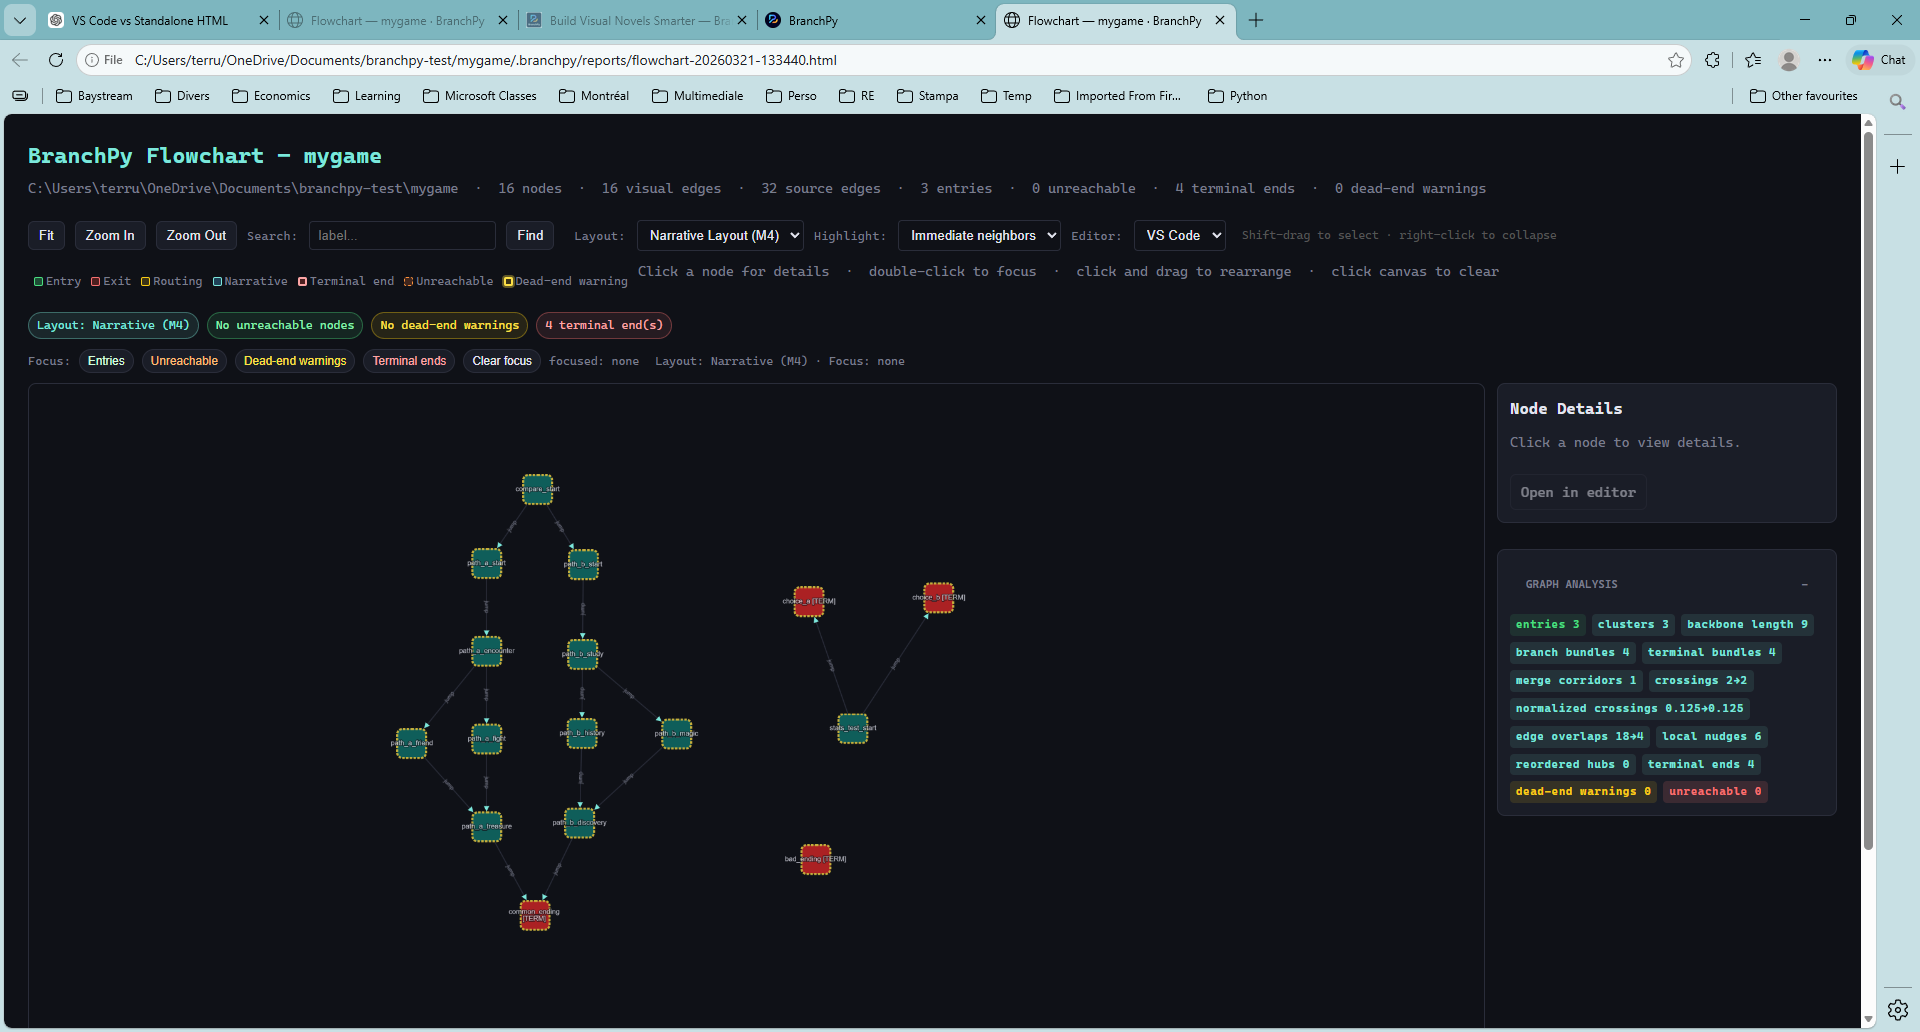
The hint bar reads: Shift-drag to select · Ctrl+Click to add · right-click to collapse · right-click group to expand.