Use this when you want proof that BranchPy is useful before deep configuration.
Goal
In 10 minutes, you will:
- run a full analysis,
- open the flowchart,
- run diagnostics,
- scan media,
- compare two runs.
1) Analyze
branchpy --project <path> analyze --open--open generates a standalone HTML report and opens it in your default browser. No VS Code required.
Expected result:
- labels/errors/warnings summary
- report and links to additional views
2) Open Flowchart
branchpy --project <path> flowchart --open--open generates an interactive HTML flowchart and opens it in your browser. From VS Code, use the Flowchart button in the Control Center for the interactive panel view.
Look for:
- disconnected areas
- dead ends
- unexpectedly dense branches
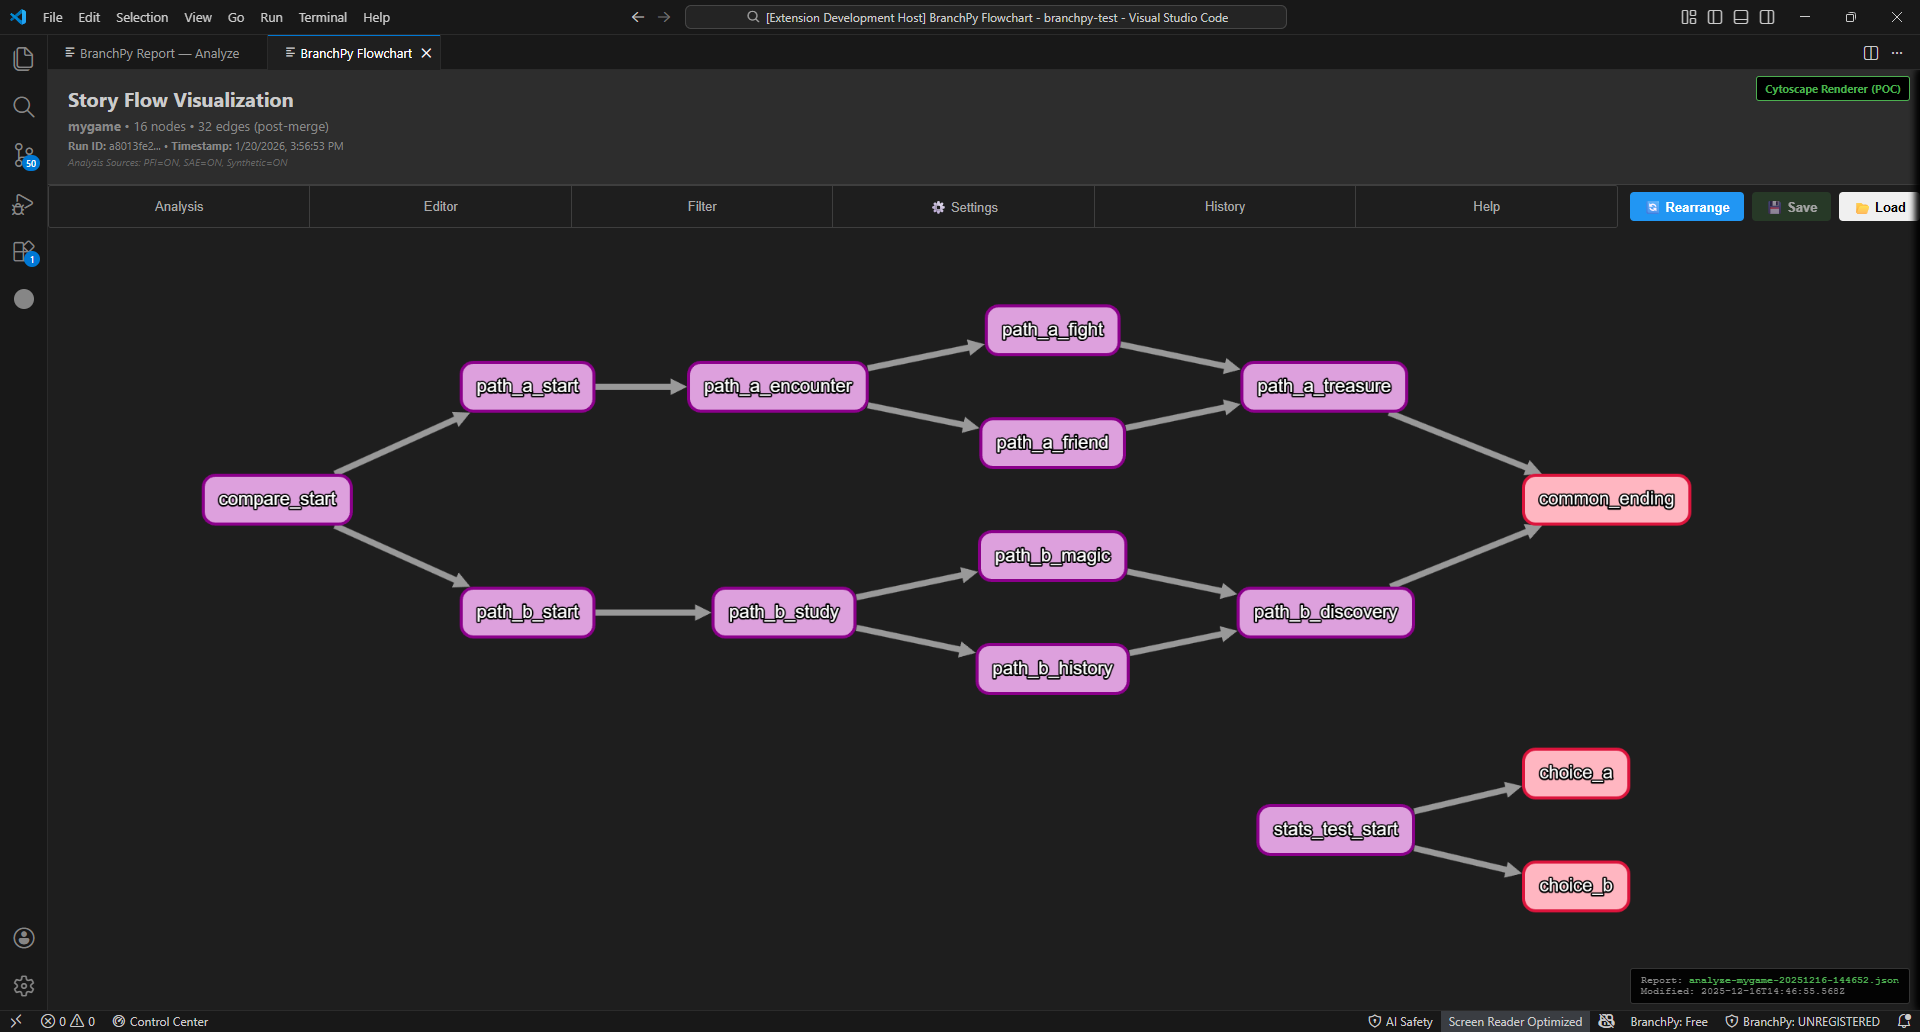
Figure: Flowchart view showing overall story structure.
3) Run Doctor
branchpy --project <path> doctor --jsonUse this when:
- setup looks broken,
- commands fail unexpectedly,
- environment consistency is unclear.
4) Run Media Validation
branchpy --project <path> media --openUse this when:
- preparing a release,
- cleaning old assets,
- investigating missing references.
5) Compare two runs
branchpy compare --old <runA> --new <runB> --jsonUse this when:
- reviewing branch changes,
- checking if fixes introduced regressions.
Typical runtime expectations
- Small VN (<200 labels): 2-5 seconds
- Medium VN (200-1000 labels): 10-30 seconds
- Large VN (>1000 labels): 30-120 seconds
Trust checklist
- Runs locally.
- Analysis does not edit your source files.
- Deterministic mode supports repeatable CI checks.
- AI features are optional.