See high-level counts and trends from your analysis runs.
What Stats shows
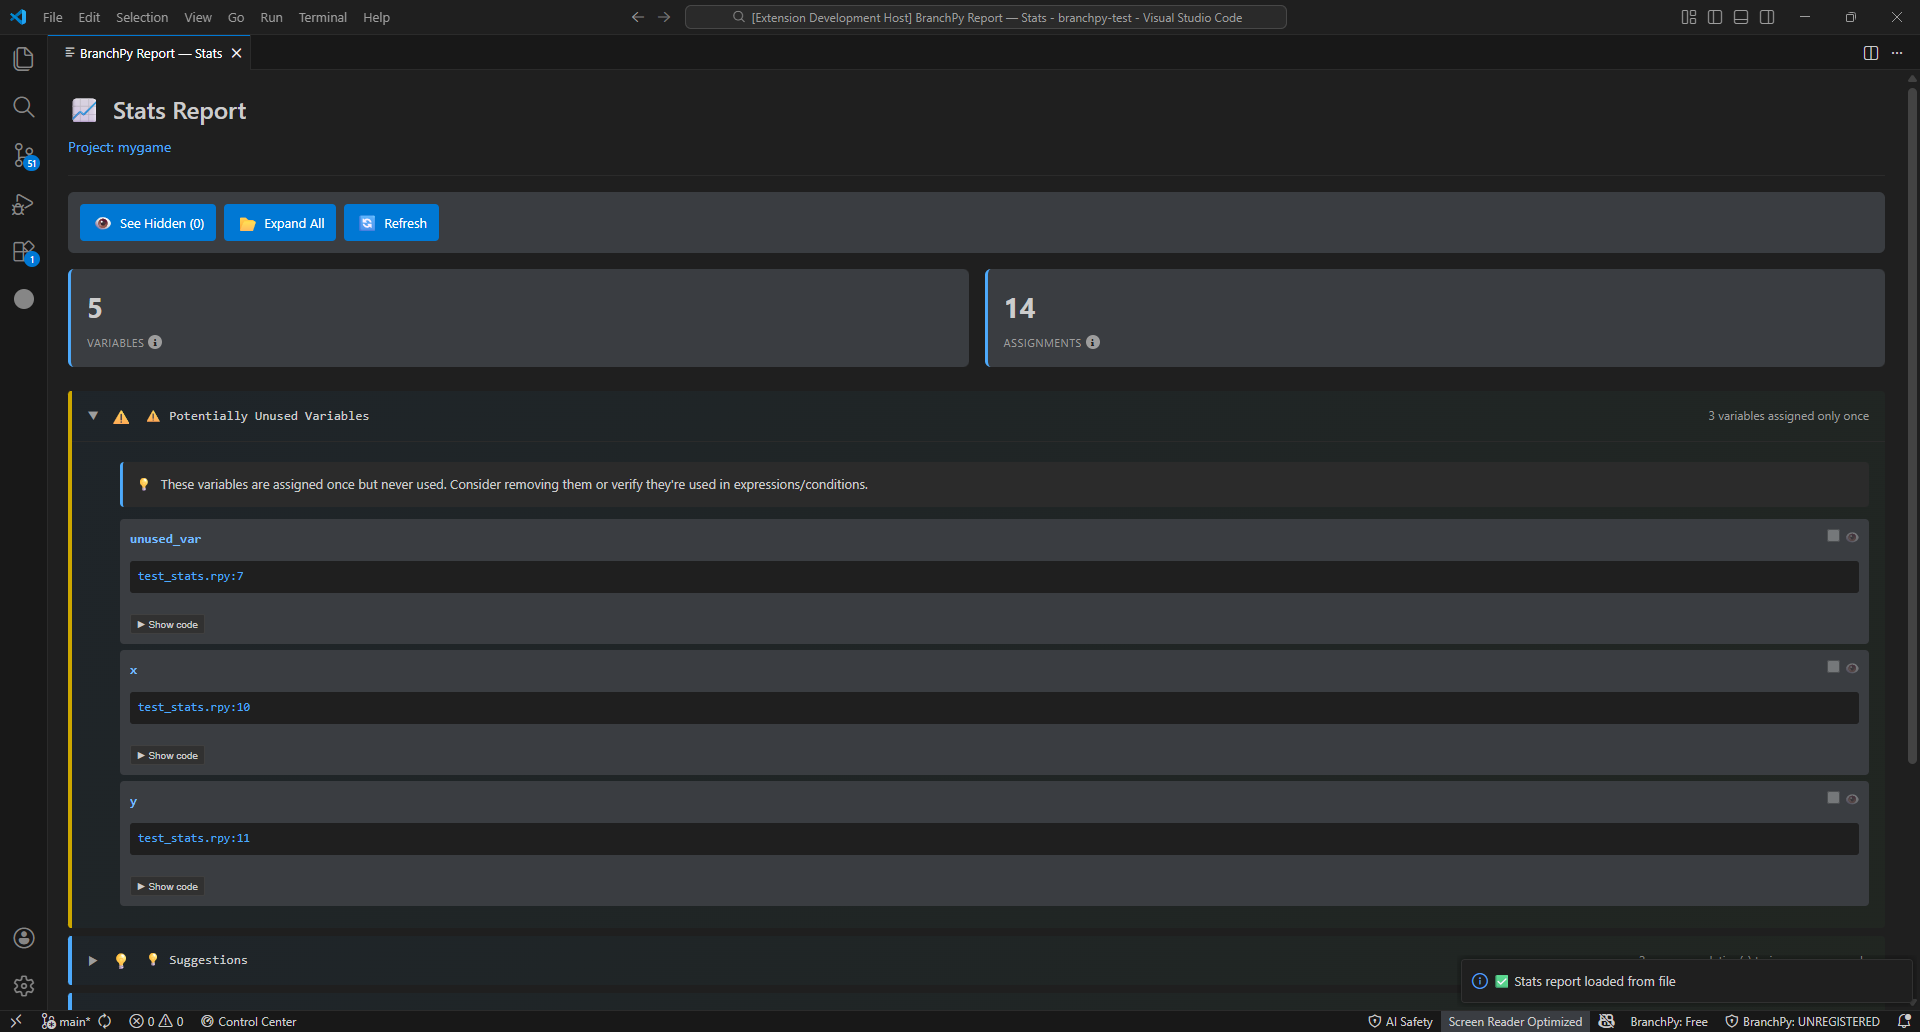
- Counts of labels, branches, choices, and other story elements.
- Totals of errors and warnings by category.
- Trends over time if you compare multiple runs (e.g., errors going down, coverage improving).
When to use Stats vs Compare
- Use Stats to understand overall health and trends (are issues decreasing?).
- Use Compare to pinpoint specific differences between two runs.
How to read changes over time
- Look at trend indicators (up/down) to see if the project is getting healthier.
- Focus on new errors first, then warnings; improvements should show decreases run over run.
Common questions Stats can answer
- Are critical errors trending down after fixes?
- How many labels/branches does the project have now?
- Did changing analysis options change counts as expected?
How to run
In VS Code
- Open Stats from BranchPy Control Center.
- Select the run or report context you want to inspect.
- Review totals, trends, and links back to related analysis outputs.
In CLI
branchpy --project <path> stats --openCommon options:
branchpy --project <path> stats [--format text|json|html] [--save] [--out <dir>]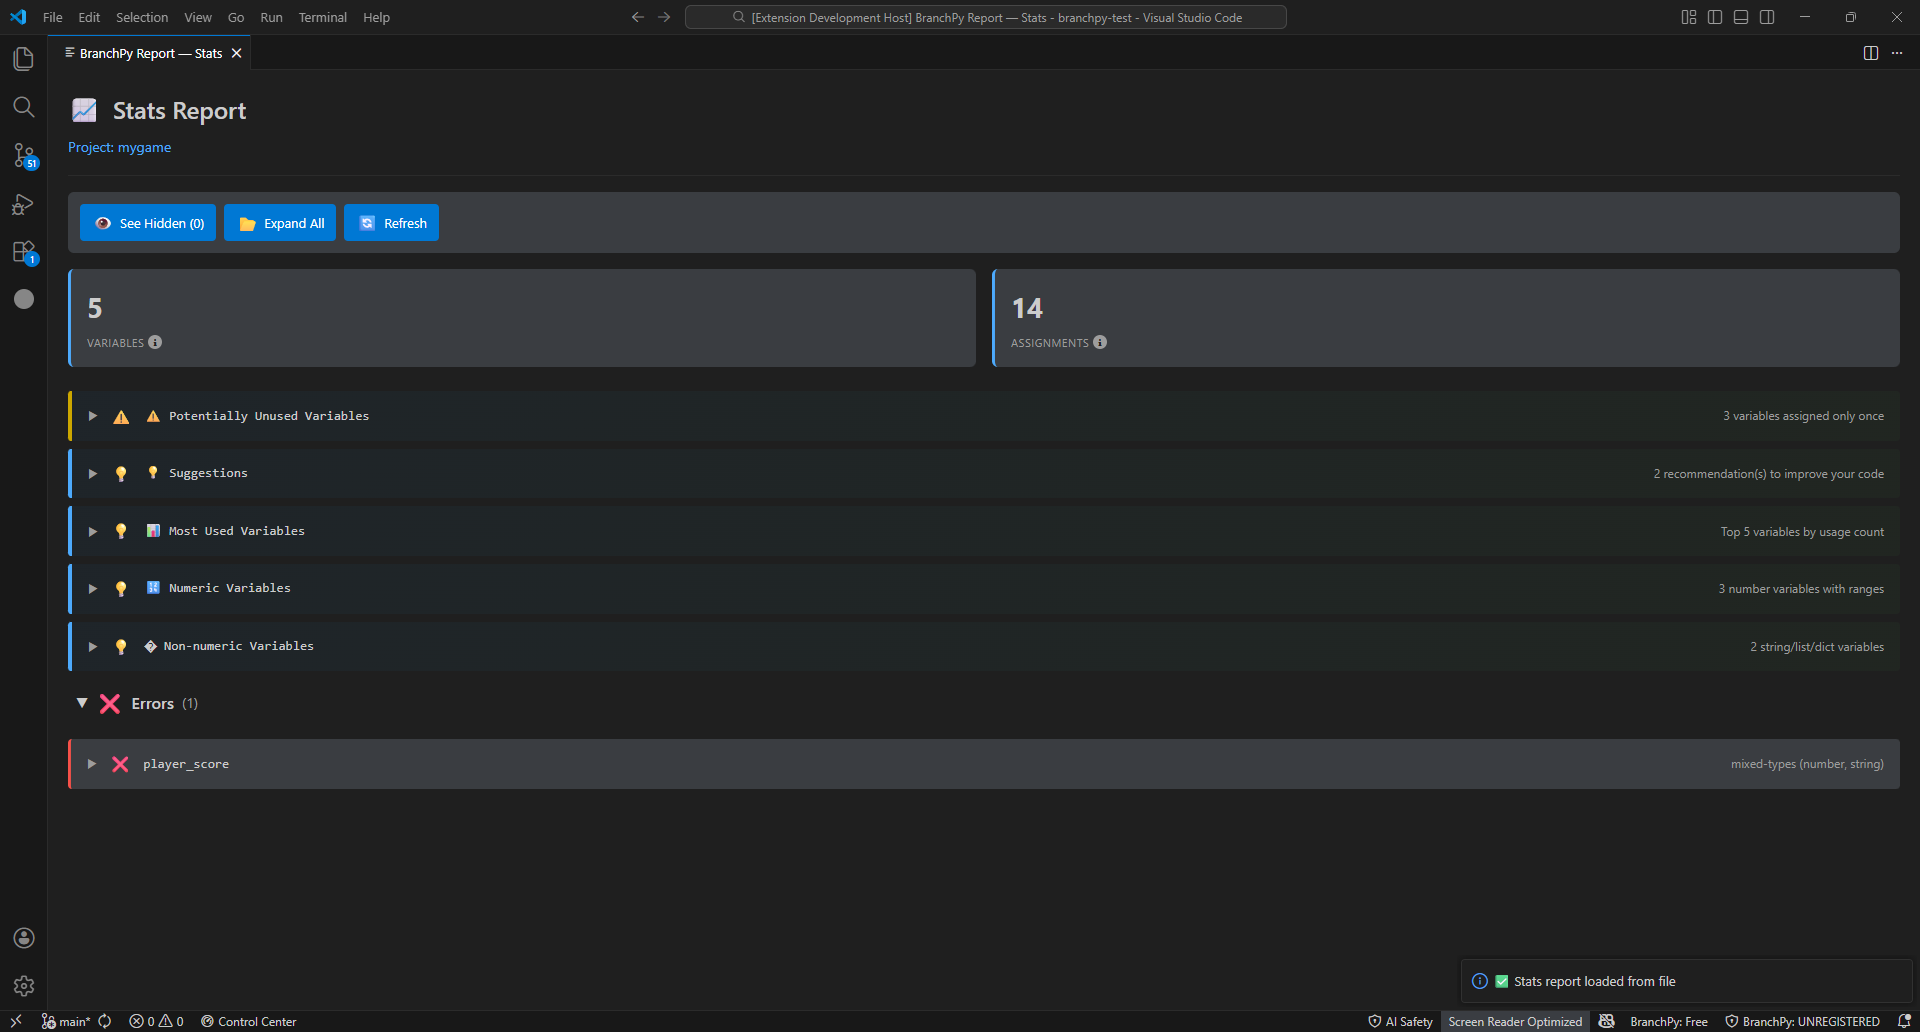
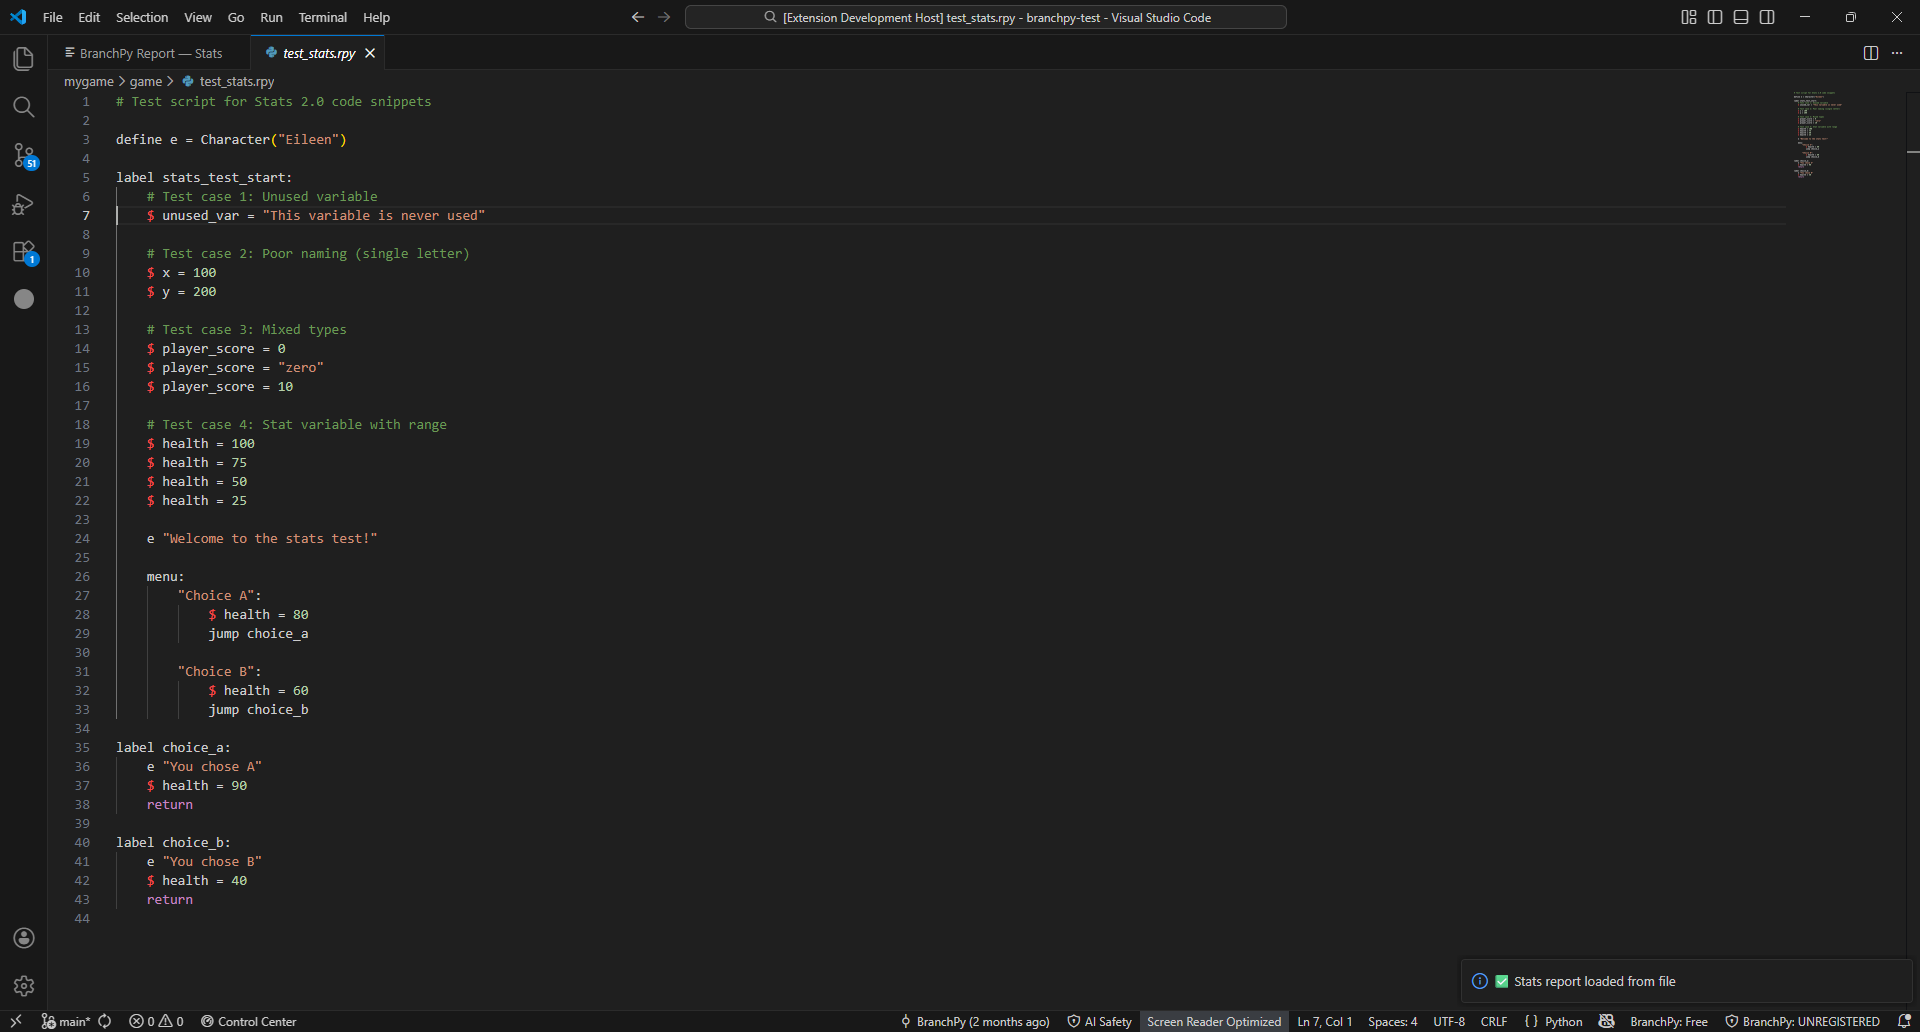
What Stats does not tell you
- It does not show per-edge provenance or flowchart structure (open Flowchart for that).
- It does not explain root causes; run Analyze/Doctor for detailed diagnostics.
Learn more: Technical/analysis